Cost-Volume-Profit (CVP) Analysis — Overview
- CVP analysis is used to answer questions such as:
- How much must I sell to earn my desired income?
- How will income be affected if I reduce selling prices to increase sales volume?
- What will happen to profitability if I expand capacity?
Think of CVP as the "what if" tool for business — like adjusting sliders in a game to see how profit changes when you tweak price, cost, or volume.
Fixed Costs (and Fixed Expenses)
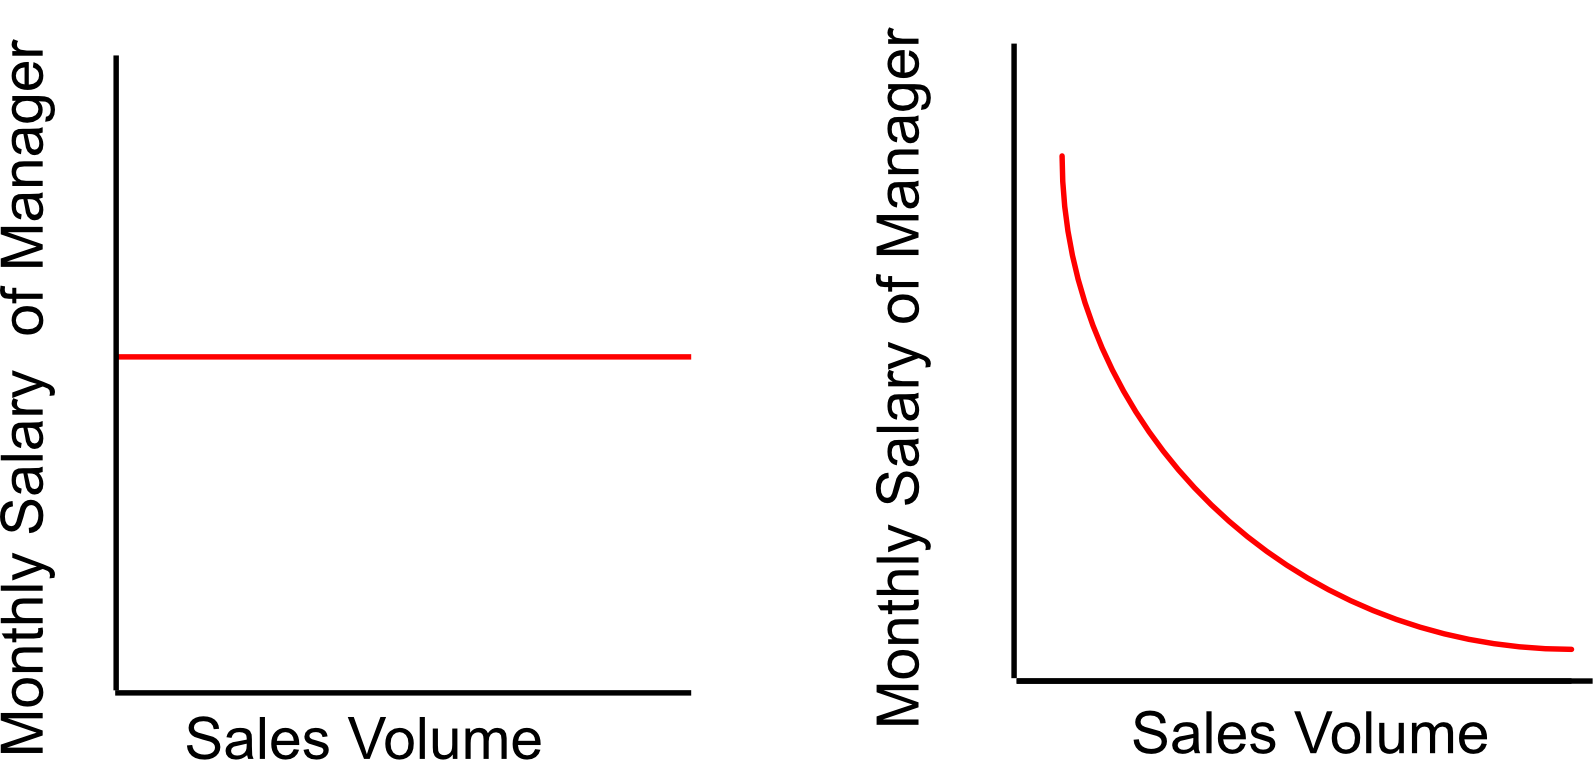
- Total fixed costs (ต้นทุนคงที่/ถาวร) remain constant as activity increases
- e.g., monthly salary of a manager stays the same regardless of how many units are sold
- Cost per unit (fixed cost per unit) decreases as activity increases
- Because the same total cost is spread over more units
| View | Behavior |
|---|---|
| Total Fixed Cost | Constant (flat line) |
| Fixed Cost Per Unit | Decreases as volume increases (curve going down) |
Like a Netflix subscription — you pay the same $15/month whether you watch 1 show or 100. The more you watch, the cheaper each show becomes "per watch."
Variable Costs (and Variable Expenses)
ค่าใช้จ่ายแปรผัน/ผันแปร
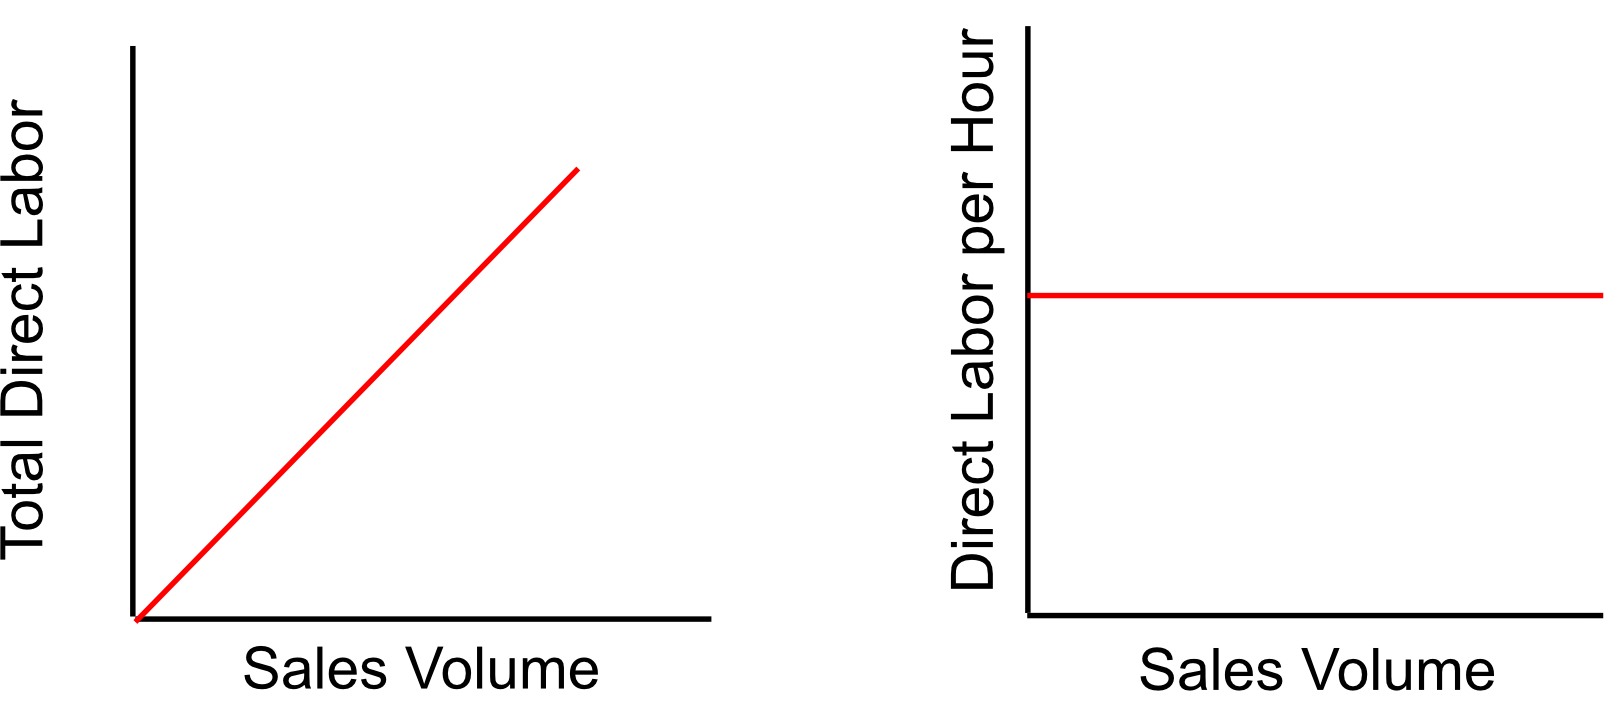
- Total variable costs increase as activity increases
- e.g., total direct labor cost rises as more units are produced
- Cost per unit (variable cost per unit) remains constant as activity increases
| View | Behavior |
|---|---|
| Total Variable Cost | Increases proportionally (straight line from origin) |
| Variable Cost Per Unit | Constant (flat line) |
Like buying boba — each cup costs ฿60 no matter how many you buy. But the more cups you buy, the higher your total spend.
Cost Behavior Summary
| Variable Costs | Fixed Costs | |
|---|---|---|
| Per Unit | Remains the same even when activity level changes | Decreases as activity level increases |
| Total | Changes as activity level changes | Remains the same over wide ranges of activity |
CVP Relationships: A Graphical Analysis
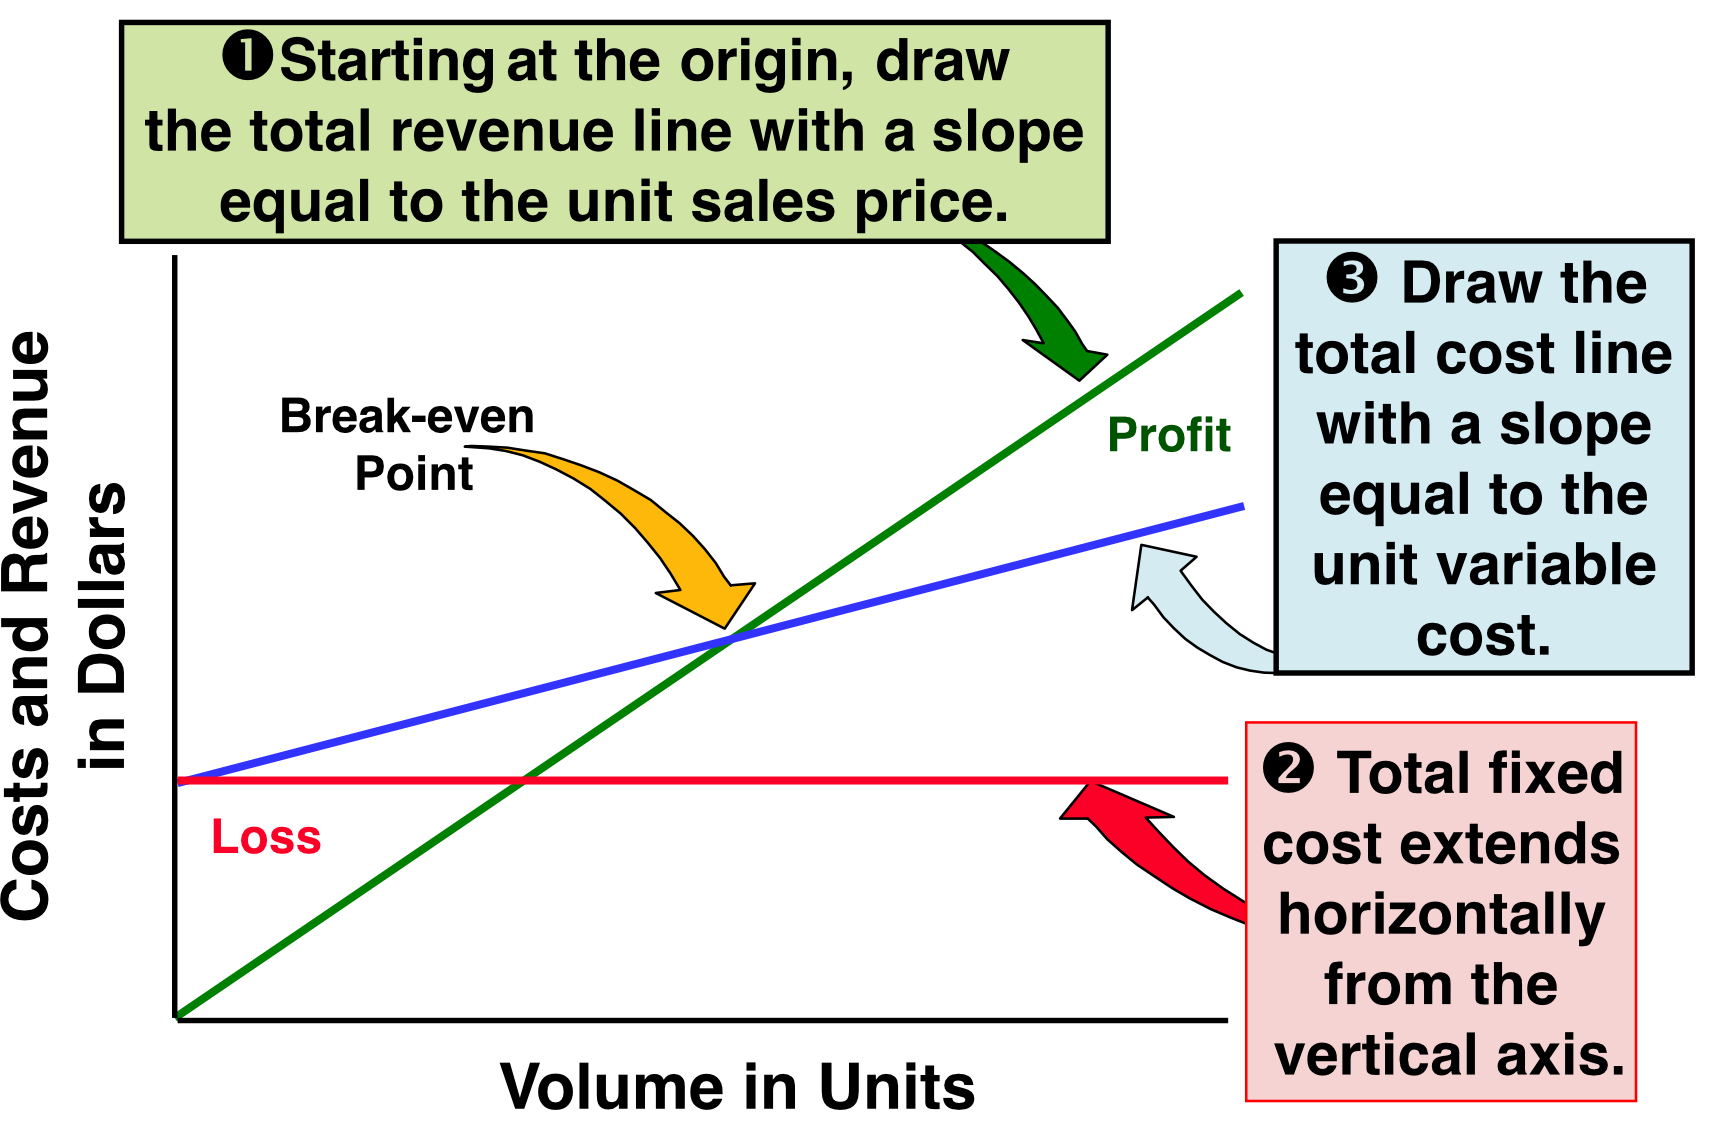
- Step 1: Starting at the origin, draw the total revenue line with a slope equal to the unit sales price
- Step 2: Total fixed cost extends horizontally from the vertical axis
- Step 3: Draw the total cost line with a slope equal to the unit variable cost
- The point where the revenue line crosses the total cost line = Break-even Point
- Above that point → Profit
- Below that point → Loss
The graph is like two roads diverging — revenue zooms up faster than cost, and where they meet is break-even. Past that point, every extra sale adds pure profit.
Computing Break-Even Point
Company ต้องรู้ break-even point ของตัวเอง
- The break-even point is the unique sales level at which a company neither earns a profit nor incurs a loss
Example
| Total | Per Unit | |
|---|---|---|
| Sales Revenue (2,000 units) | $100,000 | $50 |
| Less: Variable costs | $60,000 | $30 |
| Contribution Margin (กำไรส่วนเกิน) | $40,000 | $20 |
| Less: Fixed costs | $30,000 | |
| Operating Income | $10,000 | |
| ![[Pasted image 20260331092621.png | center | 500]] |
- Contribution Margin = Revenue − Variable Costs
- ==It is the amount by which revenue exceeds the variable costs of producing that revenue==
- Break-even = 20/unit = 1,500 units
- How many units must this company sell to cover its fixed costs (break even)?
Contribution margin is like the "leftover" after paying for ingredients. You need enough leftovers to also cover rent (fixed costs). Once rent is covered — you've broken even.
How Many Units Must We Sell? (Break-Even in Units)
- Contribution Margin per Unit = Unit Sales Price − Unit Variable Cost
Example (ABC Co.)
- Selling price: $5.00/unit
- Variable cost: $3.00/unit
- Fixed costs: $200,000
\text{Unit Contribution} = $5.00 - $3.00 = $2.00
\text{Break-even} = \frac{$200{,}000}{$2.00} = \boxed{100{,}000 \text{ units}}
How Many Dollars in Sales Must We Generate? (Break-Even in Dollars)
- Contribution Margin Ratio (CM Ratio) =
Example (ABC Co. continued)
\text{CM Ratio} = \frac{$2.00}{$5.00} = 0.40 = 40\%
\text{Break-even revenue} = \frac{$200{,}000}{0.40} = \boxed{$500{,}000}
CM Ratio tells you: for every 1 in sales goes to cover fixed costs and eventually profit.
Computing Sales Needed to Achieve Target Operating Income
- Break-even formulas can be extended to find the sales needed to earn any target income
Example (ABC Co.)
- Target income: $40,000
- Fixed costs: 2.00
\text{Units needed} = \frac{$200{,}000 + $40{,}000}{$2.00} = \frac{$240{,}000}{$2.00} = \boxed{120{,}000 \text{ units}}
Break-even is just "target income = 40K, $100K, etc.
Margin of Safety
- Margin of Safety = the amount by which sales may decline before reaching break-even
- Also used to quickly estimate operating income at any sales level:
Example
- Actual sales: 80,000
- CM Ratio: 40%
\text{Margin of Safety} = $100{,}000 - $80{,}000 = $20{,}000
\text{Operating Income} = $20{,}000 \times 0.40 = \boxed{$8{,}000}
Margin of safety is your "buffer zone." If break-even is 80K and you're selling 100K, you can afford to lose 20K in sales before going into loss territory.
Change in Operating Income
- Once break-even is reached, every additional dollar of contribution margin becomes operating income
Example
- ADM expects sales to increase by $15,000
- CM Ratio: 40%
\Delta \text{Operating Income} = $15{,}000 \times 0.40 = \boxed{$6{,}000}
After break-even, the CM ratio is basically your profit rate on new sales. Sell 6K more profit automatically.
Business Applications of CVP: Sensitivity Analysis
- Sensitivity Analysis = testing how changes in assumptions (price, cost, volume) affect operating income
- Used to evaluate business decisions such as advertising spend, price cuts, compensation changes
Base Case: Speedo Bicycle Retailer
| Total | Per Unit | % | |
|---|---|---|---|
| Sales (500 bikes) | $250,000 | $500 | 100% |
| Less: Variable expenses | $150,000 | $300 | 60% |
| Contribution Margin | $100,000 | $200 | 40% |
| Less: Fixed expenses | $80,000 | ||
| Operating Income | $20,000 |
Scenario 1: Spend $12,000 on Advertising to Increase Sales by 10%
| 500 Bikes | 550 Bikes | |
|---|---|---|
| Sales | $250,000 | 500) |
| Variable expenses | $150,000 | 300) |
| Contribution Margin | $100,000 | $110,000 |
| Fixed expenses | $80,000 | 80K + $12K) |
| Operating Income | $20,000 | $18,000 |
- ❌ No — income decreased from 18,000
Advertising cost (10K). More sales ≠ more profit if fixed costs jump too.
Scenario 2: Advertising + 10% Price Reduction → Sales Increase by 25%
- New price: 450/unit
- New units: 500 × 1.25 = 625 bikes
| 500 Bikes | 625 Bikes | |
|---|---|---|
| Sales | $250,000 | 450) |
| Variable expenses | $150,000 | 300) |
| Contribution Margin | $100,000 | $93,750 |
| Fixed expenses | $80,000 | 80K + $12K) |
| Operating Income | $20,000 | $1,750 |
- ❌ Income decreased even more — contribution margin shrank because of the price cut
Cutting price reduces contribution margin per unit. Even with more units sold, total CM can drop if the price cut is too aggressive.
Scenario 3: Advertising + Price Cut + Replace Salary with Commission
- Replace 25/unit commission (variable)
- Variable cost per unit: 25 = $325
- Sales increase: 50% above original → 750 bikes
- Fixed expenses: 50K = $42K
| 500 Bikes | 750 Bikes | |
|---|---|---|
| Sales | $250,000 | 450) |
| Variable expenses | $150,000 | 325) |
| Contribution Margin | $100,000 | $93,750 |
| Fixed expenses | $80,000 | $42,000 |
| Operating Income | $20,000 | $51,750 |
- ✅ Income increased significantly — shifting fixed costs to variable reduced risk and the volume increase more than compensated
Converting salary (fixed) to commission (variable) is a classic risk-reduction strategy. Fixed costs are "always owed," but variable costs only happen when you sell — aligning cost with revenue.
Additional Considerations in CVP
Three key areas to watch out for:
- Different products with different contribution margins → use Sales Mix analysis
- Determining semi-variable cost elements → costs that have both fixed and variable components
- Complying with the assumptions of CVP analysis
CVP Analysis When a Company Sells Many Products (Sales Mix)
- Sales Mix = the relative combination in which a company's different products are sold
- Different products have different selling prices, costs, and contribution margins
- For break-even with multiple products → use a weighted average CM ratio based on the sales mix
Example: Speedo sells Bikes and Carts
| Bikes | Carts | Total | ||||
|---|---|---|---|---|---|---|
| Sales | $250,000 | 100% | $300,000 | 100% | $550,000 | 100% |
| Variable exp. | $150,000 | 60% | $135,000 | 45% | $285,000 | 52% |
| Contribution Margin | $100,000 | 40% | $165,000 | 55% | $265,000 | 48% |
| Fixed exp. | $170,000 | |||||
| Operating Income | $95,000 |
Overall CM Ratio
\text{Overall CM Ratio} = \frac{$265{,}000}{$550{,}000} = \boxed{48\%}
Break-Even in Sales Dollars
\text{Break-even} = \frac{$170{,}000}{0.48} = \boxed{$354{,}167 \text{ (rounded)}}
With multiple products, you blend their individual CM ratios based on how much of each you sell. The more you sell of the higher-margin product, the higher your overall CM ratio — and the sooner you break even.
Assumptions Underlying CVP Analysis
For CVP to be valid, the following must hold:
- Relevant range — CVP relationships are assumed linear only within a limited range of activity
- Unit selling price remains constant
- Unit variable costs remain constant
- Total fixed costs remain constant
- Sales mix remains constant (for multi-product companies)
- Production = Sales (no changes in inventory)
CVP is a model, not reality. It's like assuming a straight road — useful for planning, but in practice roads curve. Stay aware of the assumptions when applying CVP to real decisions.