Learning Objectives
- Describe the relationship between logical and physical models
- Explain data flow diagrams (DFDs)
- Draw the four basic data flow diagram symbols
- Explain the six guidelines used when drawing data flow diagrams
- Draw context diagrams
- Draw diagram 0 data flow diagrams
- Draw lower-level data flow diagrams
- Explain how to level and balance data flow diagrams
- Create a data dictionary
- Apply process description tools in modular design
Logical Versus Physical Models
Definitions
Logical Model
- Shows what the system must do, regardless of how it will be implemented physically
- Focuses on business requirements and functionality
- Implementation-independent
Analogy: Think of a logical model like a blueprint that shows what rooms a house needs (kitchen, bedroom, bathroom) without specifying the exact materials or construction methods.
Physical Model
- Describes how the system will be constructed
- Focuses on technical implementation details
- Specifies actual hardware, software, and infrastructure
Analogy: A physical model is like the detailed construction plans showing exactly which materials to use, where pipes go, and how to build each wall.
Four-Model Approach
Many analysts follow a structured four-model approach:
- Physical model of the current system
- Documents how things are currently done
- ไปดูจริงจริงเลยว่าเขาใช้คลาวด์ยี่ห้อไหน, เซิฟเวอร์เป็นอะไร
- Logical model of the current system
- Extracts what the current system does (without implementation details)
- Logical model of the new system
- Defines what the new system must do
- Physical model of the new system
- Specifies how the new system will be built
Analogy: Like renovating a house - you document the current structure (physical current), understand what it provides (logical current), plan what you want (logical new), then design how to build it (physical new).
Data Flow Diagrams (DFDs)
Overview
- Systems analysts use graphical techniques to describe an information system
- Data Flow Diagram (DFD): Uses various symbols to show how the system transforms input data into useful information
- Shows how data moves through an information system
- Does NOT show: Program logic or processing steps
Analogy: A DFD is like a map of a city's water system - it shows how water flows from sources through pipes to destinations, but doesn't explain the chemistry of water treatment.
Data Flow Diagram Symbols
The Four Basic Symbols
DFDs use four fundamental symbols to represent:
- Processes
- Data Flows
- Data Stores
- Entities
Two Common Notation Sets:
- Gane and Sarson symbols (rectangles with rounded corners)
- Yourdon symbols (circles)
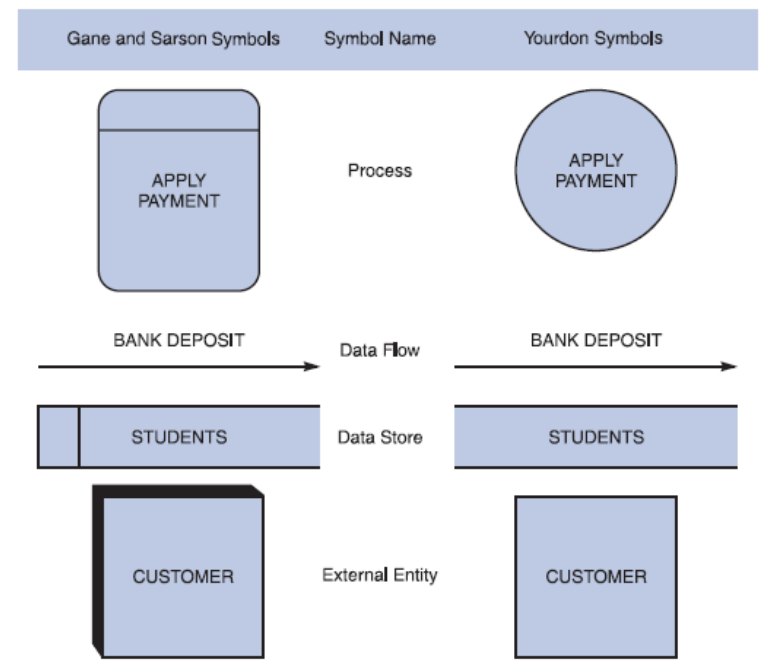
We’ll use Gane and Sarson symbols in this class! (Left one)
1. Process Symbols
Characteristics:
- Receives input data and produces output
- Contains business logic that transforms the data
- Process name identifies a specific function
- In DFDs, a process symbol can be referred to as a black box
Notation:
- Gane and Sarson: Rectangle with rounded corners
- Yourdon: Circle
- Example:
APPLY PAYMENT,GRADE STUDENT WORK
Analogy: A process is like a factory machine - it takes raw materials (input), performs some operation (transformation), and produces finished goods (output). You don't need to see inside the machine to understand what it does.
2. Data Flow Symbols
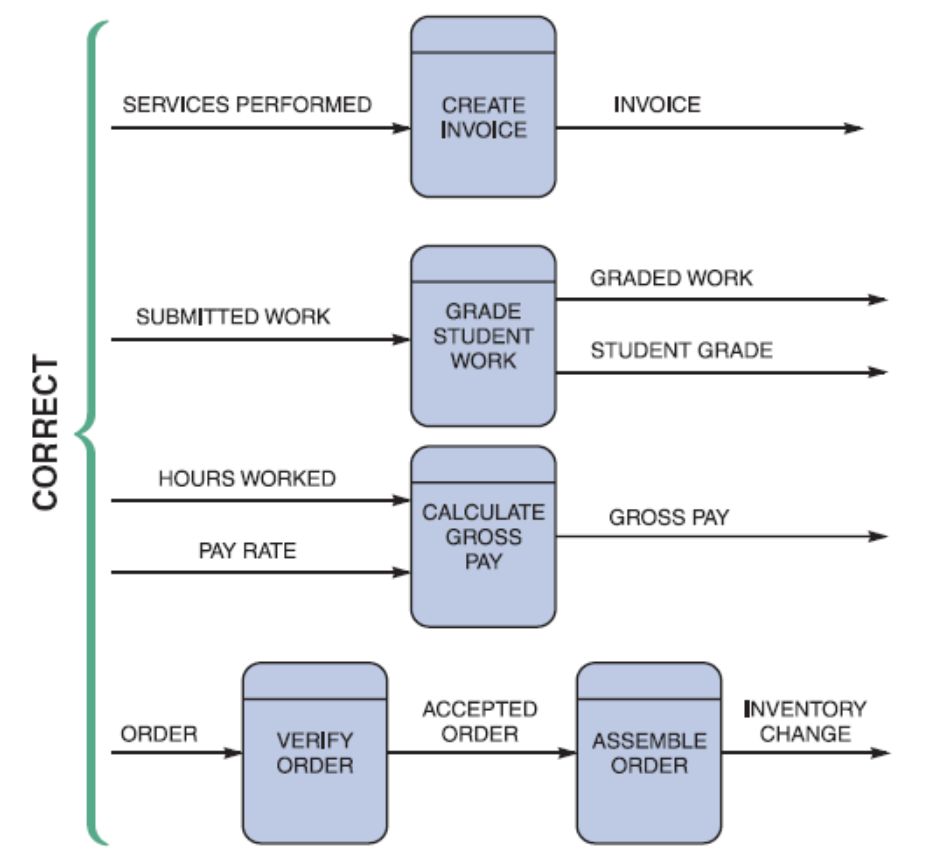
Characteristics:
- Represented by a line with a single or double arrowhead
- Shows the direction of data movement
- Must be labeled to indicate what data is flowing
Correct Combinations:
- Process to Process ✓
- Process to External Entity ✓
- Process to Data Store ✓
Incorrect Combinations:
- External Entity to External Entity ✗
- External Entity to Data Store ✗
- Data Store to Data Store ✗
3. Common Errors to Avoid
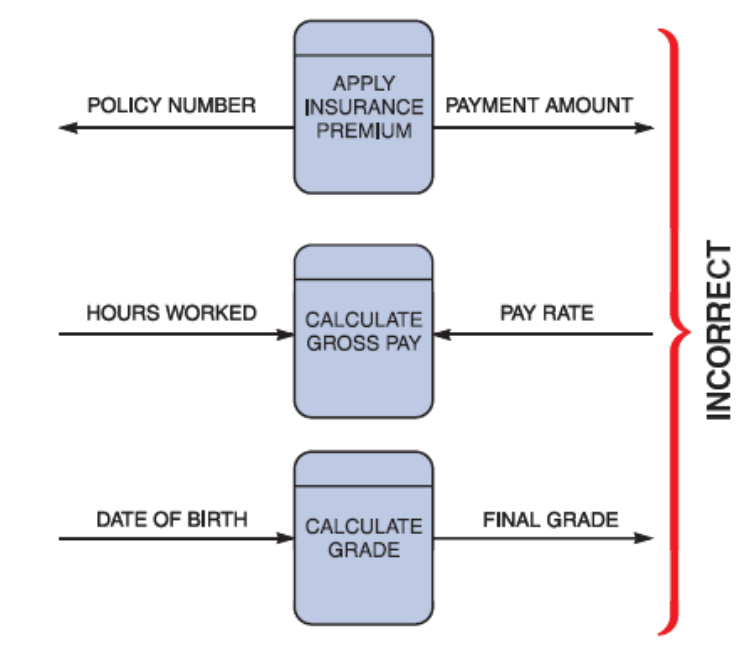
Spontaneous Generation
- Process with no input data flow
- Creates output from nothing
- Example:
APPLY INSURANCE PREMIUMwith only outputs
Black Hole
- Process with input but no output
- Data goes in and disappears
- Example:
CALCULATE GROSS PAYwith only inputs
Gray Hole
- Process where inputs are insufficient to produce the outputs
- Example:
CALCULATE GRADEreceiving onlyDATE OF BIRTHbut outputtingFINAL GRADE
Analogy: These errors are like physical impossibilities - you can't bake a cake with no ingredients (spontaneous generation), ingredients can't just vanish (black hole), and you can't make chocolate cake if you only have flour (gray hole).
4. Data Store Symbols
Characteristics:
- Represent data that the system stores
- Can be files, databases, or any persistent storage
- DFD does not show the detailed contents of a data store
- Specific structure and data elements are defined in the data dictionary
- Must be connected to a process with a data flow (not directly to entities or other data stores)
Notation:
- Gane and Sarson: Open rectangle (like a shelf)
- Yourdon: Two parallel lines
- Example:
D1 | ACCOUNTS RECEIVABLE,D2 | CUSTOMERS
Analogy: A data store is like a filing cabinet or warehouse - it holds information for future use, but the diagram doesn't show what's inside each folder or box.
5. Entity Symbols (External Entities)
Characteristics: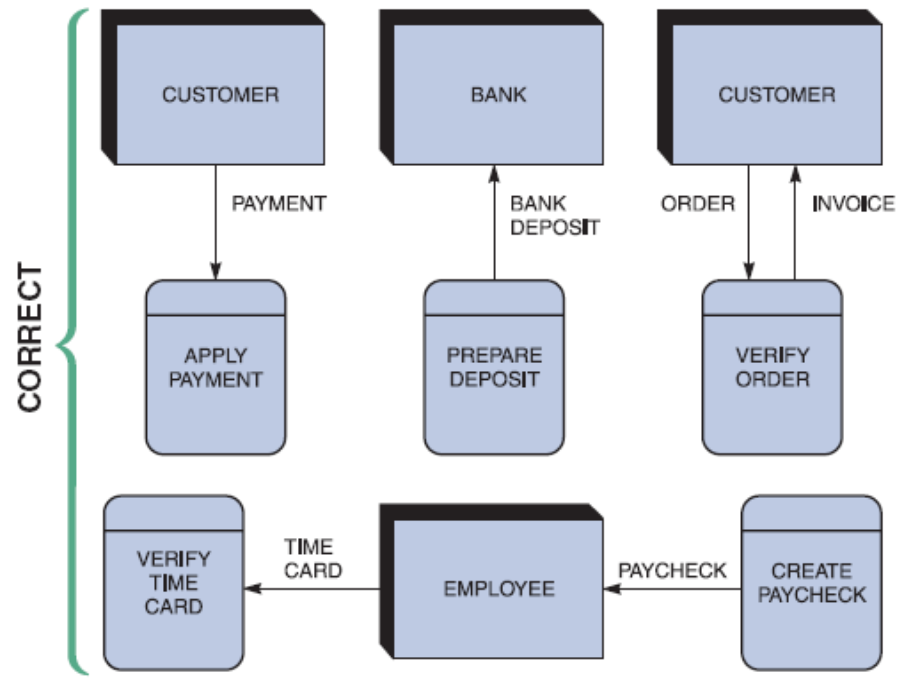
- Shows how the system interfaces with the outside world
- Represents external sources or destinations of data
- Also called terminators (data origins or final destinations)
- Also called source and sink entities
- Can only connect to processes (not directly to data stores or other entities)
Examples: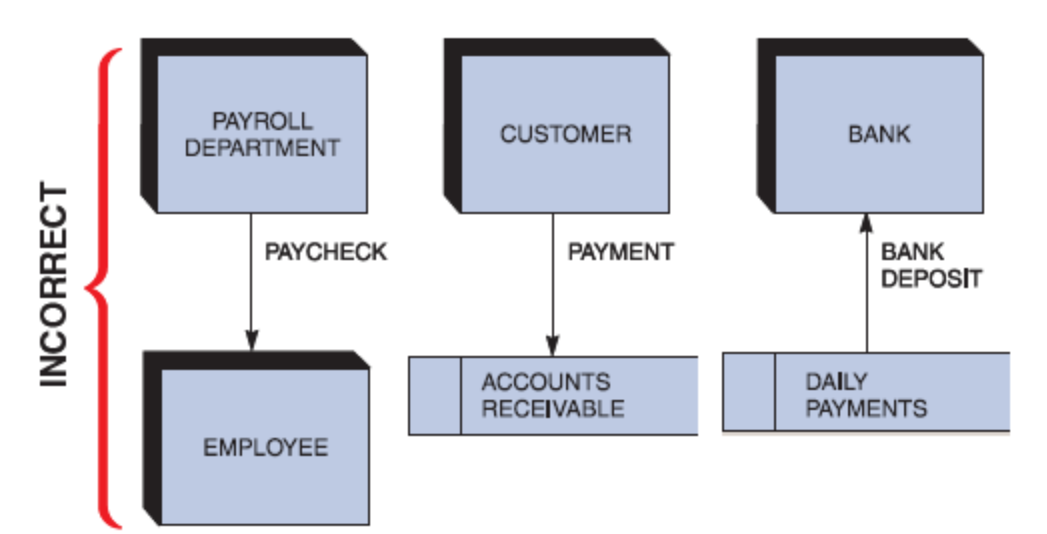
CUSTOMERWAREHOUSEBANKEMPLOYEEACCOUNTING
Analogy: External entities are like the people or organizations outside your company - customers who send orders, suppliers who deliver goods, or banks that process payments. They interact with your system but aren't part of it.
Summary of Data Flow Rules
| From/To | Process | External Entity | Data Store |
|---|---|---|---|
| Process | ✓ | ✓ | ✓ |
| External Entity | ✓ | ✗ | ✗ |
| Data Store | ✓ | ✗ | ✗ |
| ![[Pasted image 20260213124105.png | center | 300]] |
Drawing Data Flow Diagrams
General Approach
- Create graphical model based on fact-finding results
- Review guidelines for drawing DFDs
- Apply guidelines and create a set of DFDs
Six Guidelines for Drawing DFDs
- Draw the context diagram so that it fits on one page
- Keep it simple and high-level
- Use the name of the information system as the process name in the context diagram
- Example: "ORDER SYSTEM"
- Use unique names within each set of symbols
- No duplicate process names
- No duplicate data store names
- Consistent naming throughout
- Do not cross lines
- Keep diagrams clean and readable
- Rearrange symbols if necessary
- Provide a unique name and reference number for each process
- Example:
1 | FILL ORDER,2 | CREATE INVOICE
- Example:
- Ensure that the model is accurate, easy to understand, and meets the needs of its users
- Validate with stakeholders
- Maintain clarity and precision
Context Diagram
Definition
- First step in constructing a set of DFDs
- Shows the entire system as a single process (process 0)
- Displays all external entities and data flows between them and the system
- Provides the highest-level view of the system
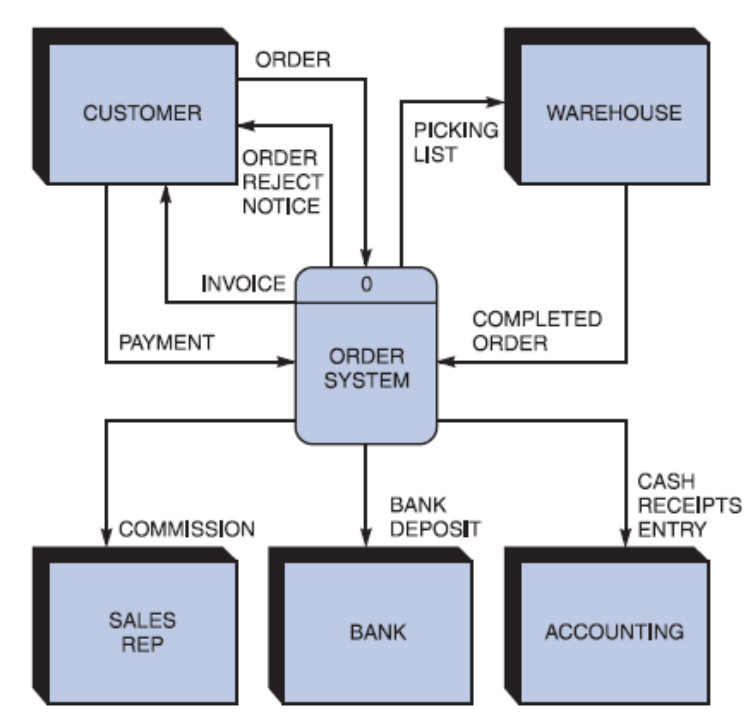
Do not use double head arrow! (Unclear!)
Characteristics
- Only one process (the system itself)
- Shows all external entities
- Shows all major data flows in and out of the system
- No data stores (internal storage not shown at this level)
Example: Order System Context Diagram
External Entities:
CUSTOMER- places orders, receives invoicesWAREHOUSE- receives picking lists, sends completed ordersSALES REP- receives commissionsBANK- receives bank depositsACCOUNTING- receives cash receipts entry
Data Flows:
- ORDER (from Customer to System)
- ORDER REJECT NOTICE (from System to Customer)
- INVOICE (from System to Customer)
- PAYMENT (from Customer to System)
- PICKING LIST (from System to Warehouse)
- COMPLETED ORDER (from Warehouse to System)
- COMMISSION (from System to Sales Rep)
- BANK DEPOSIT (from System to Bank)
- CASH RECEIPTS ENTRY (from System to Accounting)
Analogy: The context diagram is like a satellite view of a factory - you see what goes in and out, and who it interacts with, but you don't see the internal departments or processes.
Diagram 0 DFD
Definition
- Shows the detail inside the black box from the context diagram
- Breaks down the single process into major functional processes
- Shows data stores used by the system
- Maintains balance with the context diagram
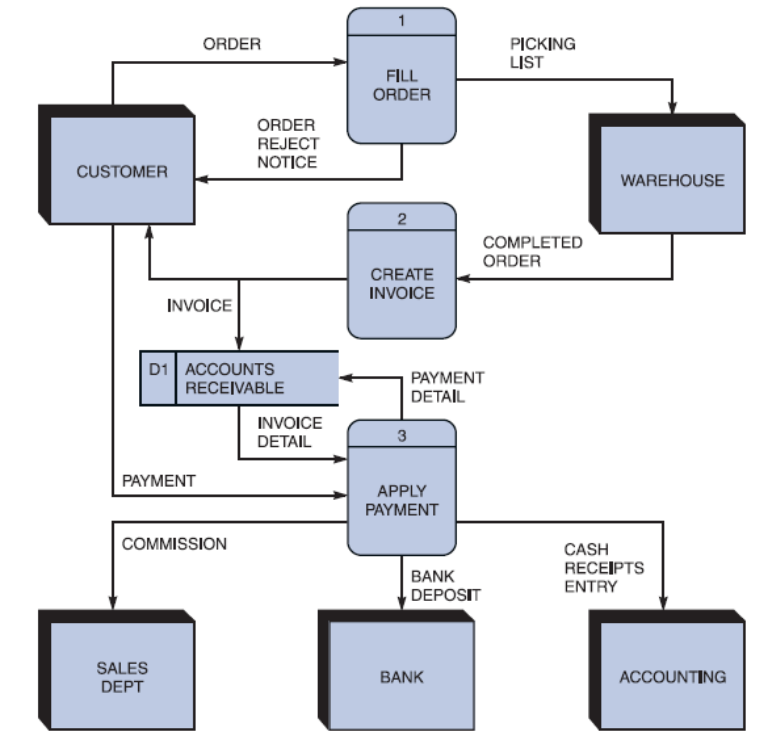
Characteristics
- Multiple numbered processes (1, 2, 3, etc.)
- Data stores appear at this level
- Same external entities as context diagram
- Same external data flows as context diagram
Example: Order System Diagram 0
Processes:
FILL ORDER- processes customer ordersCREATE INVOICE- generates invoices for completed ordersAPPLY PAYMENT- processes customer payments
Data Stores:
D1 | ACCOUNTS RECEIVABLE- tracks customer invoices and payments
Key Concept:
- The data flows entering and leaving Diagram 0 must match those in the context diagram (this is called balancing)
Analogy: Diagram 0 is like zooming in from the satellite view to see the main departments in the factory - you now see Production, Billing, and Finance as separate areas, plus the filing cabinets (data stores) they use.
Drawing Lower-Level DFDs
Leveling and Balancing
Leveling
- Process of creating increasingly detailed DFDs
- Each process can be "exploded" into a lower-level diagram
- Continues until reaching functional primitives (processes that cannot be further decomposed)
Balancing
- Ensures that input and output data flows are consistent between levels
- Parent process must have same data flows as the child diagram
Diagram Numbering Convention
- Context diagram: Process
0 - Diagram 0: Processes
1,2,3, etc. - Diagram 1 (exploded from process 1): Processes
1.1,1.2,1.3, etc. - Diagram 2 (exploded from process 2): Processes
2.1,2.2,2.3, etc. - Diagram 1.1 (exploded from process 1.1): Processes
1.1.1,1.1.2, etc.
Example: Diagram 1 (FILL ORDER Details)
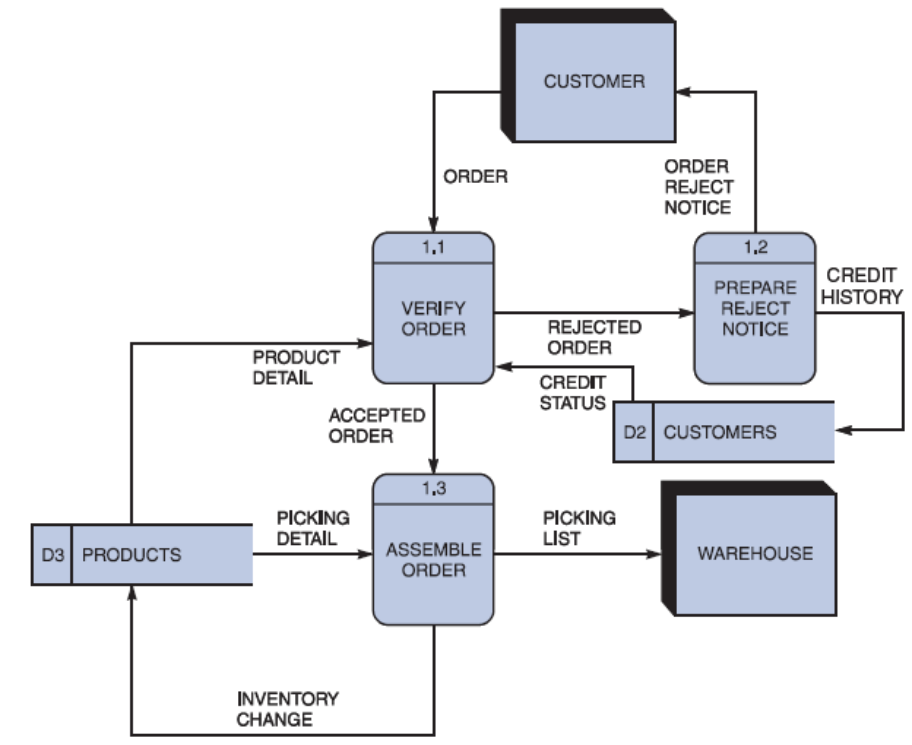
Processes in Diagram 1:
1.1 | VERIFY ORDER- checks customer credit and product availability1.2 | PREPARE REJECT NOTICE- creates notices for rejected orders1.3 | ASSEMBLE ORDER- prepares picking list for warehouse
Data Stores:
D2 | CUSTOMERS- customer information and credit statusD3 | PRODUCTS- product details and inventory
Internal Data Flows:
- Data flows between the sub-processes
- These internal flows don't appear in the parent diagram
Analogy: Leveling is like using a microscope with increasing magnification - each level shows more detail about what's happening inside a process.
Balancing Rules
Parent Process (Diagram 0, Process 1: FILL ORDER):
- Inputs: ORDER
- Outputs: ORDER REJECT NOTICE, PICKING LIST
Child Diagram (Diagram 1):
- Must have the same inputs: ORDER
- Must have the same outputs: ORDER REJECT NOTICE, PICKING LIST
- Can show internal data flows and data stores not visible in parent
Important: The external interfaces must match exactly between parent and child.
Common Balancing Error
Incorrect: A child diagram showing data flows that don't appear in the parent process
- Example: Diagram 1 showing ORDER coming in, but parent process not showing ORDER as input
Correct: All data flows entering/leaving the child diagram must match the parent process
Leveling Example: Process 3 (APPLY PAYMENT)
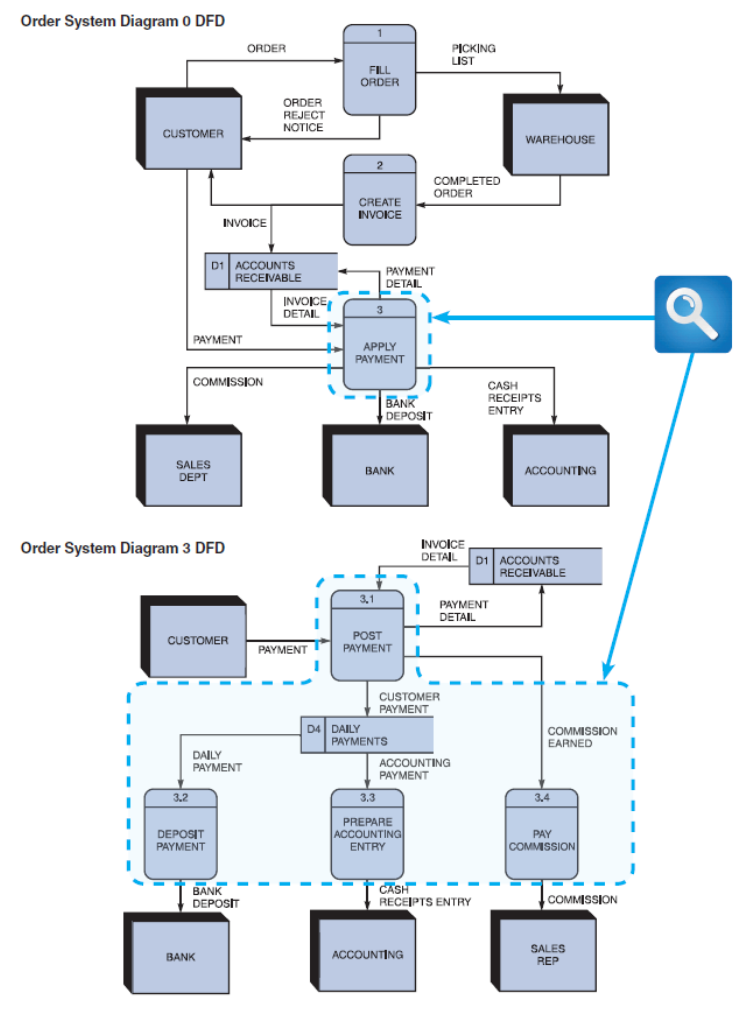
Parent: Diagram 0, Process 3
Inputs:
- INVOICE DETAIL (from D1 ACCOUNTS RECEIVABLE)
- PAYMENT (from CUSTOMER)
Outputs:
- COMMISSION (to SALES DEPT)
- BANK DEPOSIT (to BANK)
- CASH RECEIPTS ENTRY (to ACCOUNTING)
Child: Diagram 3
Sub-processes:
3.1 | VERIFY PAYMENT- validates customer payment3.2 | DEPOSIT PAYMENT- prepares bank deposit3.3 | PAY COMMISSION- calculates and records sales commission
Data Stores:
D4 | DAILY PAYMENTS- temporary storage for payment processing
Internal Flows:
- CUSTOMER PAYMENT (between 3.1 and 3.2)
- DAILY PAYMENT (between processes and D4)
- ACCOUNTING AMOUNT (between 3.2 and 3.3)
- COMMISSION EARNED (between processes)
Balancing Check: ✓
- Same inputs as parent: INVOICE DETAIL, PAYMENT
- Same outputs as parent: COMMISSION, BANK DEPOSIT, CASH RECEIPTS ENTRY
Data Dictionary
Definition
- Central storehouse of information about a system's data
- Used to collect, document, and organize specific facts about a system
- Defines and describes all data elements and meaningful combinations of data elements
Purpose
- Provides clear, comprehensive information about data and processes
- Ensures consistency in data definitions
- Serves as a reference for developers and users
- Supports system documentation and maintenance
Analogy: The data dictionary is like a detailed encyclopedia for your system - every piece of data has an entry explaining exactly what it is, where it comes from, and how it's used.
Data Dictionary Components
1. Data Elements (Data Items or Fields)
Definition:
- Smallest piece of data that has meaning within an information system
Documented Attributes:
- Data element name and label
- Unique identifier for the element
- Example:
customer_id,order_date
- Alias
- Alternative names
- Example:
cust_id,customer_number
- Type and length
- Data type (text, number, date, boolean, etc.)
- Maximum length or size
- Example:
VARCHAR(50),INTEGER,DATE
- Default value
- Value assigned if none is provided
- Example:
status = 'Active',quantity = 1
- Acceptable values
- Valid range or set of values
- Example:
status IN ('Active', 'Inactive', 'Pending') - Example:
quantity > 0
- Source
- Where the data originates
- Example: Customer input, calculated value, system-generated
- Security
- Access restrictions
- Example: Public, Confidential, Restricted
- Responsible user(s)
- Who owns or maintains this data
- Example: Sales Manager, Database Administrator
- Description and comments
- Detailed explanation of the element
- Business rules or constraints
- Usage notes
Analogy: Documenting a data element is like creating a specification sheet for a part - you list its name, what it's made of, acceptable dimensions, where it comes from, and how it should be used.
2. Records (Data Structures)
Definition:
- Meaningful combination of related data elements
- Included in a data flow or retained in a data store
Documented Attributes:
- Record or data structure name
- Example:
CUSTOMER_RECORD,ORDER_DETAIL
- Example:
- Definition or description
- Purpose and usage of the record
- Alternate name(s)
- Other names used for this structure
- Attributes (data elements)
- List of all fields in the record
- Example:
CUSTOMER = customer_id + name + address + phone + email
Notation:
+means "composed of"[ | ]means "either/or" (selection){ }means "iterations of" (repeating group)( )means "optional"
Example:
ORDER = order_id + order_date + customer_id + {order_line} + order_total
order_line = product_id + quantity + unit_price + line_total
3. Data Flows
Documented Attributes:
- Data flow name or label
- Example:
CUSTOMER_ORDER,INVOICE
- Example:
- Description
- What information the flow carries
- Alternate name(s)
- Other names for this flow
- Origin
- Where the data flow starts
- Example:
CUSTOMERentity,VERIFY ORDERprocess
- Destination
- Where the data flow ends
- Example:
FILL ORDERprocess,D1 ACCOUNTS RECEIVABLEdata store
- Record
- Data structure carried by the flow
- Example:
ORDER = order_id + customer_id + {order_item} + order_date
- Volume and frequency
- How often and how much data flows
- Example: "500 orders per day", "Peak: 100/hour during business hours"
4. Data Stores
Documented Attributes:
- Data store name or label
- Example:
D1 | ACCOUNTS RECEIVABLE,D2 | CUSTOMERS
- Example:
- Description
- Purpose and contents of the data store
- Alternate name(s)
- Other names for this store
- Example:
AR_FILE,CUSTOMER_DATABASE
- Attributes
- Data elements and records stored
- Example:
CUSTOMERS = {customer_record}
- Volume and frequency
- Number of records
- Access patterns
- Example: "10,000 customer records", "Updated daily", "Accessed 1,000 times/day"
5. Processes
Documented Attributes:
- Process name or label
- Example:
1.1 | VERIFY ORDER,3.2 | DEPOSIT PAYMENT
- Example:
- Description
- What the process does
- Process number
- Unique identifier in the DFD hierarchy
- Example:
1.1,3.2.1
- Process description
- Detailed logic (using structured English, decision tables, or decision trees)
- Business rules
- Algorithms
6. Entities
Documented Attributes:
- Entity name
- Example:
CUSTOMER,WAREHOUSE,BANK
- Example:
- Description
- Type of external entity
- Role in the system
- Alternate name(s)
- Other names for this entity
- Input data flows
- Data flows from the system to this entity
- Example:
INVOICE,ORDER REJECT NOTICE
- Output data flows
- Data flows from this entity to the system
- Example:
ORDER,PAYMENT
Using CASE Tools for Documentation
Benefits
- Consistency: Ensures data consistency across all diagrams and documentation
- Central Repository: All system information stored in one place
- Automatic Updates: Changes propagate throughout the system
- Complexity Management: Handles complex systems more easily than manual methods
- Validation: Checks for errors and inconsistencies
CASE Repository:
- Central database of all system information
- Links DFDs, data dictionary, and other documentation
- Ensures that all references are consistent
Analogy: CASE tools are like a master blueprint system with automatic cross-referencing - when you update a definition in one place, it automatically updates everywhere that definition is used.
Data Dictionary Reports
Common types of reports that can be generated:
- Alphabetized list of all data elements
- Quick reference guide
- Shows all fields in the system
- Report describing each data element and indicating the user or department
- Ownership and responsibility tracking
- Report of all data flows and data stores that use a particular data element
- Impact analysis
- "Where-used" reporting
- Detailed reports showing all characteristics
- Complete specifications for:
- Data elements
- Records
- Data flows
- Processes
- Entities
- Any other selected item stored in the data dictionary
- Complete specifications for:
Analogy: Data dictionary reports are like different views of a library catalog - you can look up books alphabetically, by author, by subject, or see complete details about any book.
Process Description Tools in Modular Design
Overview
- Documents the details of a functional primitive
- Represents a specific set of processing steps and business logic
- Used when a process cannot be decomposed further
Typical Tools:
- Structured English
- Decision Tables
- Decision Trees
Object-Oriented Context
In O-O development:
- Combines data and processes into objects
- Similar objects grouped into classes
- Processes are called methods
- Same tools can describe method logic
Modular Design
Definition
Based on combinations of logical structures (control structures) which serve as building blocks for processes.
Three Building Blocks
1. Sequence
- Steps executed in order, one after another
- Most basic structure
Example:
1. Read customer order
2. Validate customer credit
3. Check product availability
4. Calculate order total
2. Selection (Conditional)
- Choose between alternative paths based on a condition
- IF-THEN-ELSE logic
Example:
IF customer_credit_status = 'Good' THEN
    Accept order
ELSE
    Reject order
ENDIF
3. Iteration (Loop)
- Repeat steps while a condition is true or for a set number of times
- DO-WHILE, REPEAT-UNTIL, FOR loops
Example:
FOR each item in order
    Calculate line_total = quantity × unit_price
    Add line_total to order_total
ENDFOR
Analogy: These three structures are like LEGO blocks - you can build any complex process by combining sequences (stacking blocks), selections (choosing between different paths), and iterations (repeating patterns).
Structured English
Definition
- Subset of standard English that describes logical processes clearly and accurately
- Uses limited vocabulary and simple syntax
- Eliminates ambiguity
Guidelines
- Use only the three building blocks
- Sequence
- Selection (IF-THEN-ELSE)
- Iteration (DO-WHILE, REPEAT-UNTIL, FOR)
- Use indentation for readability
- Shows structure and nesting levels
- Makes logic easier to follow
- Use a limited vocabulary
- Standard action verbs: READ, WRITE, CALCULATE, ADD, SUBTRACT, etc.
- Domain-specific terms from data dictionary
- Avoid ambiguous terms
Example: Process Payment
READ customer payment
READ invoice detail from ACCOUNTS RECEIVABLE

IF payment_amount = invoice_amount THEN
    SET invoice_status to 'Paid'
    CALCULATE commission = invoice_amount × commission_rate
    WRITE commission to SALES DEPT
    WRITE payment to DAILY PAYMENTS
ELSE IF payment_amount < invoice_amount THEN
    CALCULATE remaining_balance = invoice_amount - payment_amount
    SET invoice_status to 'Partial Payment'
    WRITE payment to DAILY PAYMENTS
ELSE
    WRITE payment_error to customer
ENDIF

FOR each payment in DAILY PAYMENTS
    ADD payment_amount to deposit_total
ENDFOR

WRITE deposit_total to BANK
WRITE deposit_total to ACCOUNTING
Analogy: Structured English is like a recipe - it uses simple, clear steps that anyone can follow, with indentation showing which steps go together (like ingredients for different parts of the dish).
Decision Tables
Definition
- Logical structure that shows every combination of conditions and outcomes
- Systematic way to document complex business rules
- Ensures all possibilities are considered
Structure
Four Parts:
- Condition Stub
- Left column listing all conditions
- Condition Entry
- Shows whether each condition is True (Y), False (N), or Not Relevant (-)
- Action Stub
- Left column listing all possible actions
- Action Entry
- Shows which actions to take (X marks the action)
Key Principle
- Number of rules doubles each time a condition is added
- Formula: where = number of conditions
Examples:
- 1 condition → 2 rules
- 2 conditions → 4 rules
- 3 conditions → 8 rules
- 4 conditions → 16 rules
Example: Sales Promotion Policy
Conditions:
- Preferred customer?
- Ordered $1,000 or more?
- Used our charge card?
Actions:
- 5% discount
- Additional 5% discount
- $25 bonus coupon
- $5 bonus coupon
Initial Decision Table (8 rules):
| Rule | 1 | 2 | 3 | 4 | 5 | 6 | 7 | 8 |
|---|---|---|---|---|---|---|---|---|
| Preferred customer | Y | Y | Y | Y | N | N | N | N |
| Ordered $1,000 or more | Y | Y | N | N | Y | Y | N | N |
| Used our charge card | Y | N | Y | N | Y | N | Y | N |
| 5% discount | X | X | X | X | ||||
| Additional 5% discount | X | |||||||
| $25 bonus coupon | X | X | ||||||
| $5 bonus coupon | X | X | X | X |
Simplification Process
Step 1: Identify irrelevant conditions using dashes (-)
| Rule | 1 | 2 | 3 | 4 | 5 | 6 | 7 | 8 |
|---|---|---|---|---|---|---|---|---|
| Preferred customer | Y | Y | Y | Y | N | N | N | N |
| Ordered $1,000 or more | Y | Y | N | N | - | - | - | - |
| Used our charge card | Y | N | - | - | - | - | - | - |
| 5% discount | X | X | ||||||
| Additional 5% discount | X | |||||||
| $25 bonus coupon | X | X | ||||||
| $5 bonus coupon | X | X | X | X |
Step 2: Combine rules with identical outcomes
Final Simplified Table:
| Rule | 1 | 2 | 3 | 4 | 5 |
|---|---|---|---|---|---|
| Preferred customer | Y | Y | Y | Y | N |
| Ordered $1,000 or more | Y | Y | N | N | - |
| Used our charge card | Y | N | - | - | - |
| 5% discount | X | X | |||
| Additional 5% discount | X | ||||
| $25 bonus coupon | X | X | |||
| $5 bonus coupon | X |
Result: Reduced from 8 rules to 5 rules
Analogy: A decision table is like a complete troubleshooting chart - it lists every possible combination of symptoms and tells you exactly what action to take for each combination.
Decision Trees
Definition
- Graphical representation of conditions, actions, and rules found in a decision table
- Shows the same logic in a visual, tree-like format
- Many viewers find this format easier to interpret than tables
Structure
Components:
- Root (left side): Starting point
- Branches: Represent conditions and choices
- Nodes: Decision points (shown as condition questions)
- Leaves (right side): Final outcomes/actions
Example: Sales Promotion Policy Decision Tree
                                        Y → Used our     → Y → 5% discount and
                         Y → Ordered       charge card?       an additional 5%
                             $1,000 or                         discount
                             more?       → N → 5% discount
Preferred    → Y
customer?                 → N                           → $25 bonus coupon

             → N                                        → $5 bonus coupon
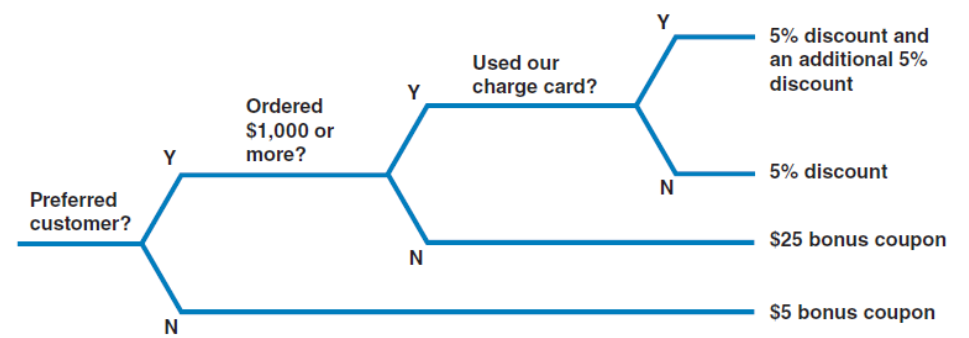
Reading the tree:
- Start at left (Preferred customer?)
- Follow branches based on Yes/No answers
- Arrive at outcome on the right
Same information as decision table, different presentation!
Advantages
- Visual clarity: Easy to follow the logic flow
- Intuitive: Natural left-to-right reading
- Quick reference: Find outcomes rapidly
- Easy to verify: Can trace any scenario
Disadvantages
- Can become very wide with many conditions
- May be harder to ensure completeness than tables
Analogy: A decision tree is like a "choose your own adventure" book flowchart - you start at the beginning and follow branches based on your choices until you reach an ending.
When to Use Each Tool
Structured English
Best for:
- Sequential processes with few decisions
- Processes with complex calculations
- When narrative description is clearer
- Simple business rules
Example: "Calculate gross pay by multiplying hours worked by pay rate"
Decision Tables
Best for:
- Complex set of conditions
- Many possible combinations
- Need to ensure all cases are covered
- Business rules with multiple factors
Example: "Determine discount based on customer type, order amount, and payment method"
Decision Trees
Best for:
- Moderate number of conditions
- When visual representation helps understanding
- Sequential decision-making processes
- Presenting to non-technical stakeholders
Example: "Troubleshooting guide for order rejection reasons"
Analogy: These tools are like different types of maps - structured English is like written directions, decision tables are like a grid showing all intersections, and decision trees are like a visual map showing paths to different destinations.
Summary
Structured Analysis Tools
Used to develop models during systems analysis and design:
- Logical model: During systems analysis phase
- Physical model: During systems design phase
Main Tools for Data and Process Modeling
-
Data Flow Diagrams (DFDs)
- Context diagram (highest level)
- Diagram 0 (major processes)
- Lower-level diagrams (detailed processes)
- Uses leveling and balancing techniques
-
Data Dictionary
- Documents all data elements
- Describes data flows, data stores, processes, entities
- Ensures consistency and completeness
-
Process Descriptions
- Structured English
- Decision tables
- Decision trees
Functional Primitives
Each functional primitive process must be documented using one or more of:
- Structured English (for sequential logic)
- Decision tables (for complex conditions)
- Decision trees (for visual decision logic)
Key Concepts to Remember
-
Logical vs. Physical
- Logical = WHAT the system does
- Physical = HOW the system is implemented
-
Four DFD Symbols
- Process (transforms data)
- Data Flow (movement of data)
- Data Store (persistent storage)
- Entity (external sources/destinations)
-
DFD Hierarchy
- Context diagram → Diagram 0 → Lower-level diagrams
- Each level shows more detail
-
Balancing
- Child diagram inputs/outputs must match parent process
- Ensures consistency across levels
-
Data Dictionary
- Central repository for all system data
- Documents every element in detail
-
Process Description Tools
- Use the simplest tool that clearly describes the logic
- All three tools can represent the same logic
- Choose based on complexity and audience
Final Analogy: Building a system model is like creating a detailed city plan - you start with a map showing the city boundaries and connections (context diagram), zoom in to show neighborhoods and major streets (Diagram 0), then detail individual buildings and their functions (lower-level diagrams), while maintaining a comprehensive address book (data dictionary) that describes everything in the city.