Access Technology: if you want to access the internet; what kind of options do you have?
Instructor: Dr. Apichon Witayangkurn (apichon@siit.tu.ac.th)
Roadmap
- Access Network
- Internet Service Provider (ISP)
- Internet structure
- Internet Speed vs Connection Speed
- Network Speed bottleneck
The Internet
Definition
- The Internet is a global network of billions of computers and other electronic devices
- With the Internet, it's possible to:
- Access almost any information
- Communicate with anyone else in the world
- Do much more
Internet Components
Billions of connected computing devices:
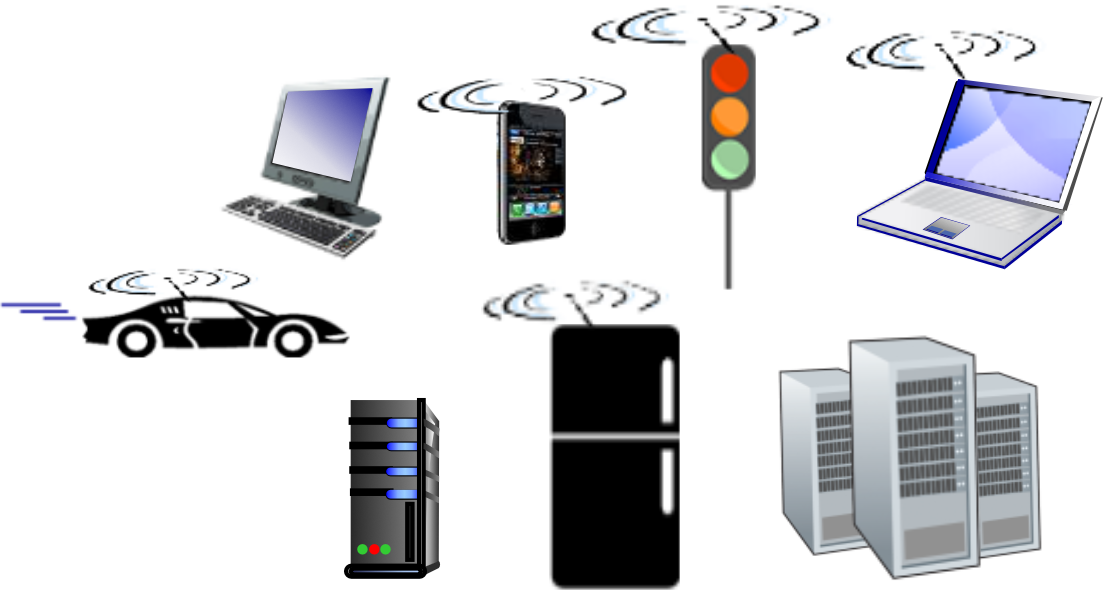
- hosts = end systems
- Running network apps at Internet's "edge"
Packet switches: forward packets (chunks of data)
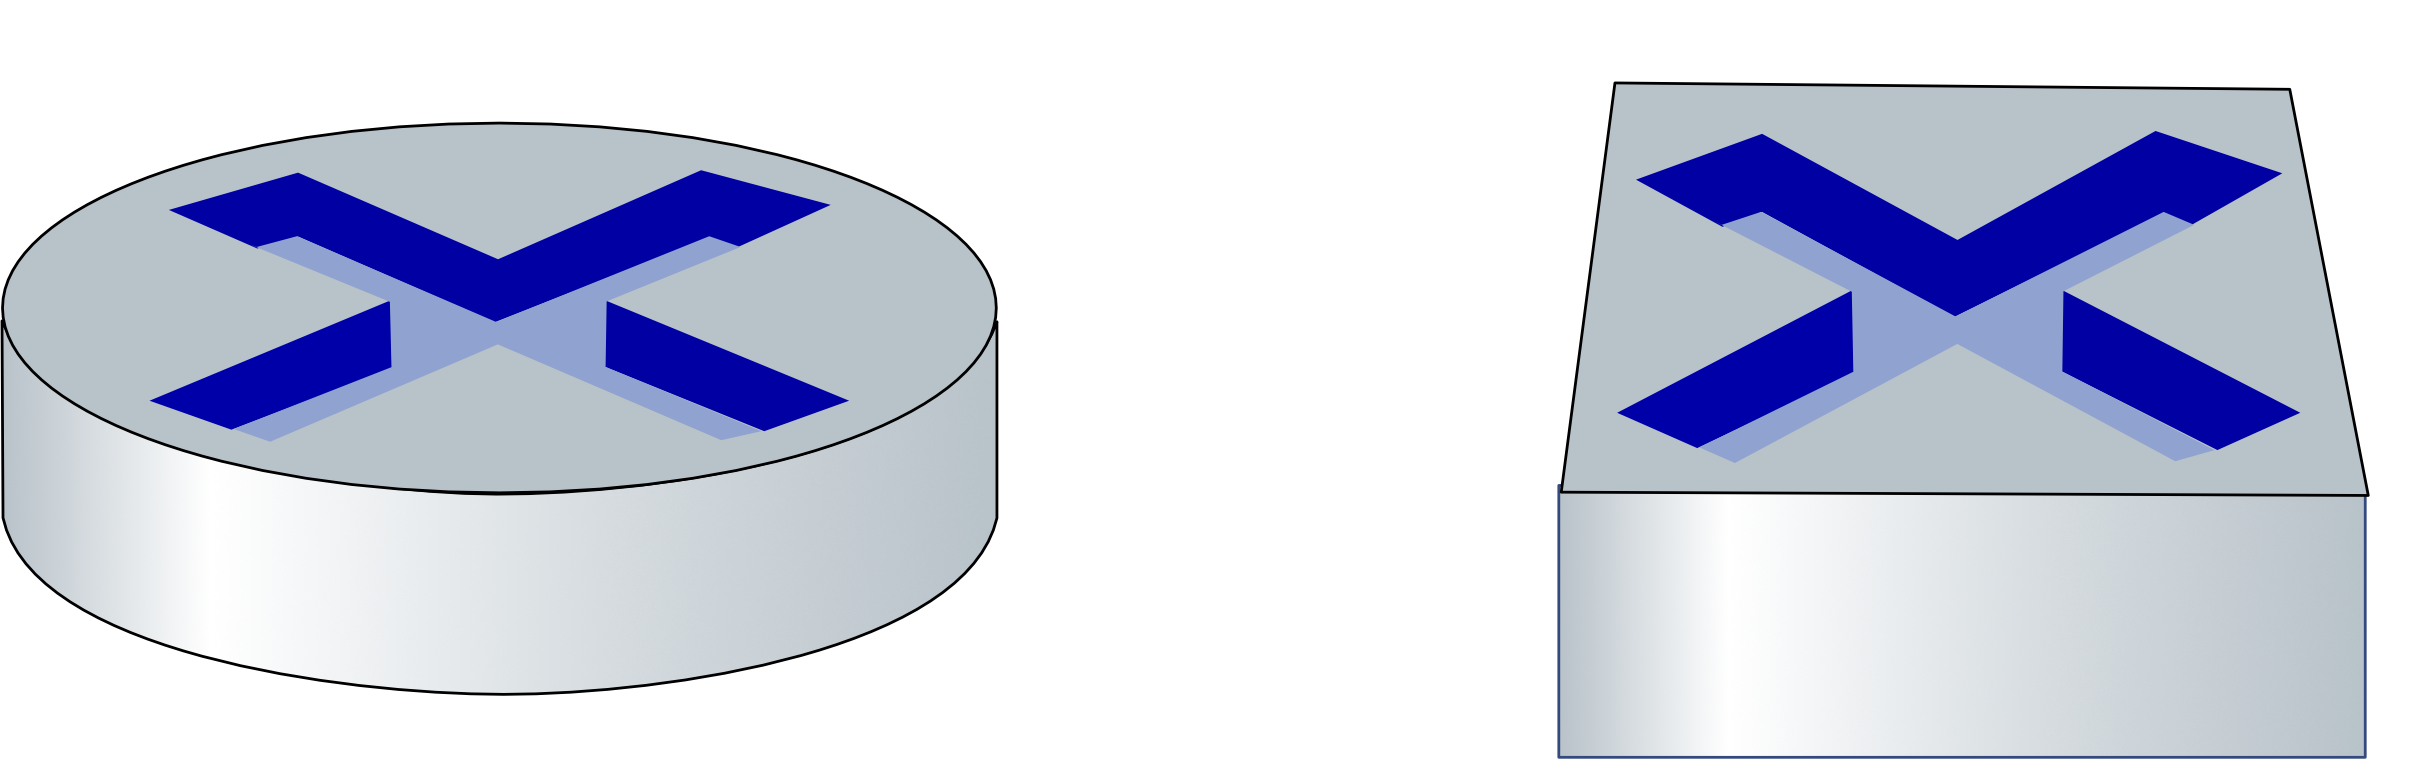
- routers, switches
Communication links
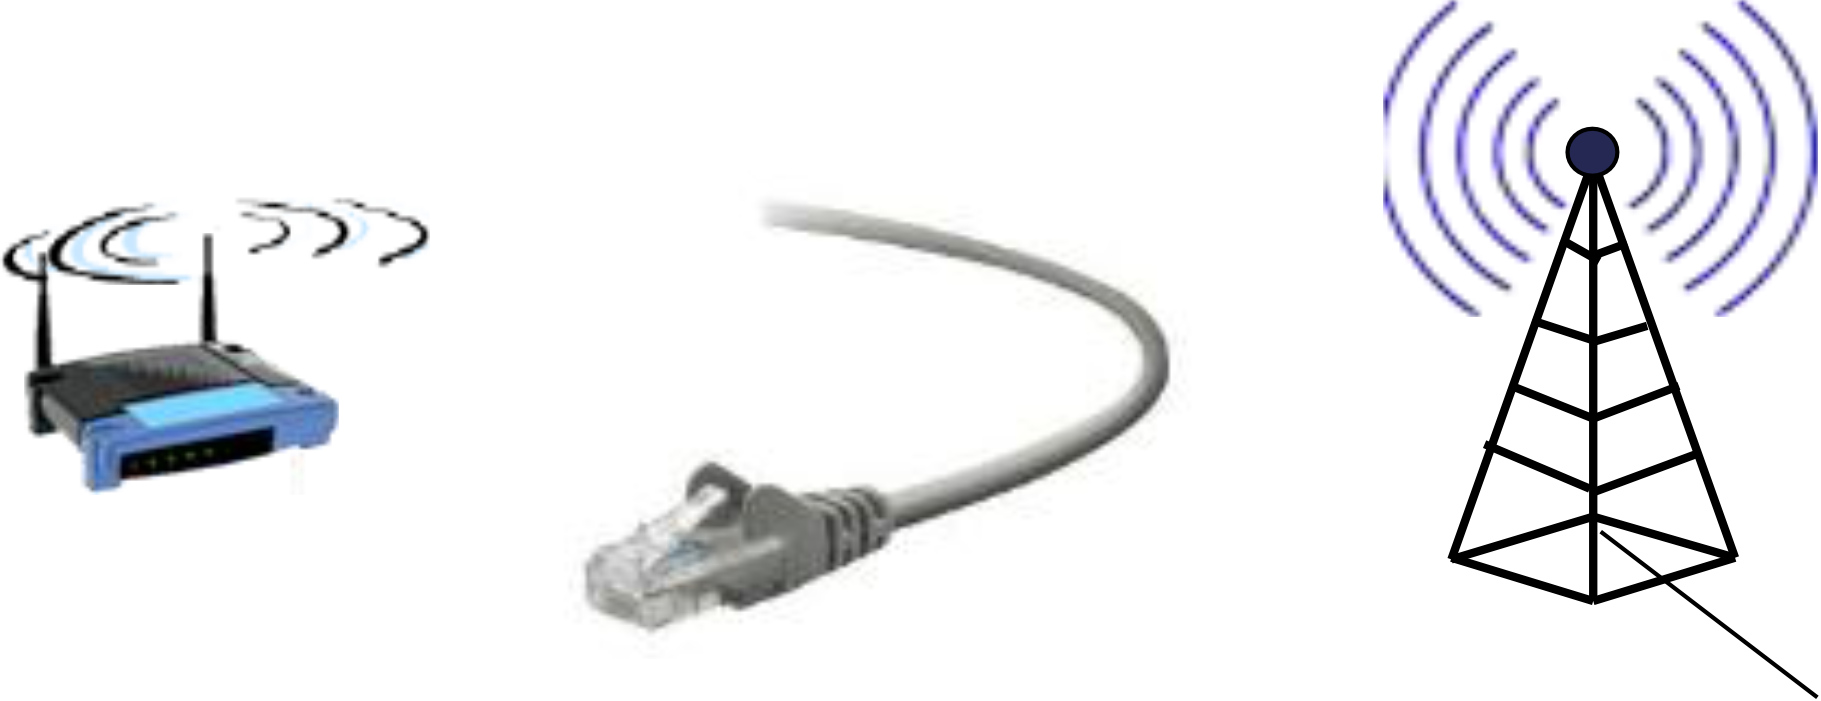
- fiber, copper, radio, satellite
- transmission rate: bandwidth
Networks

- Collection of devices, routers, links: managed by an organization
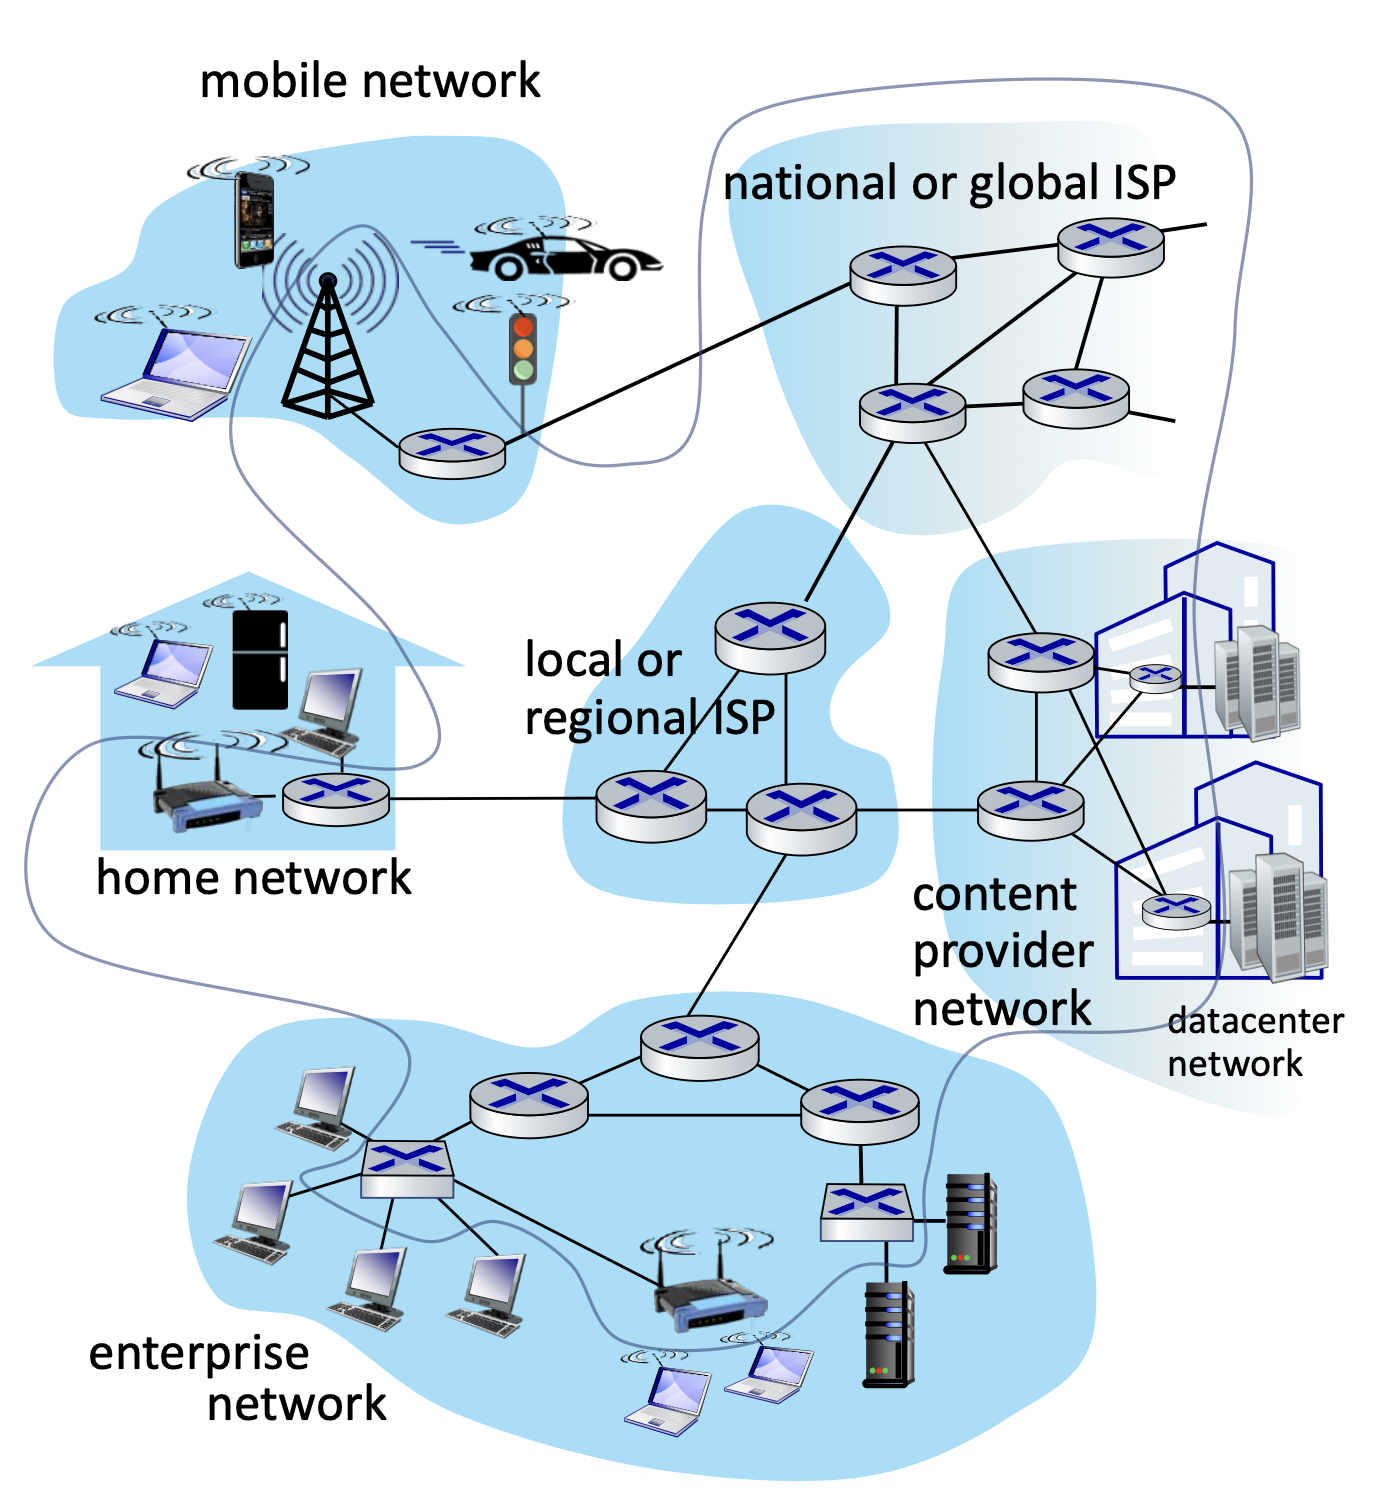
Access Networks
How ISP Provide Network Access
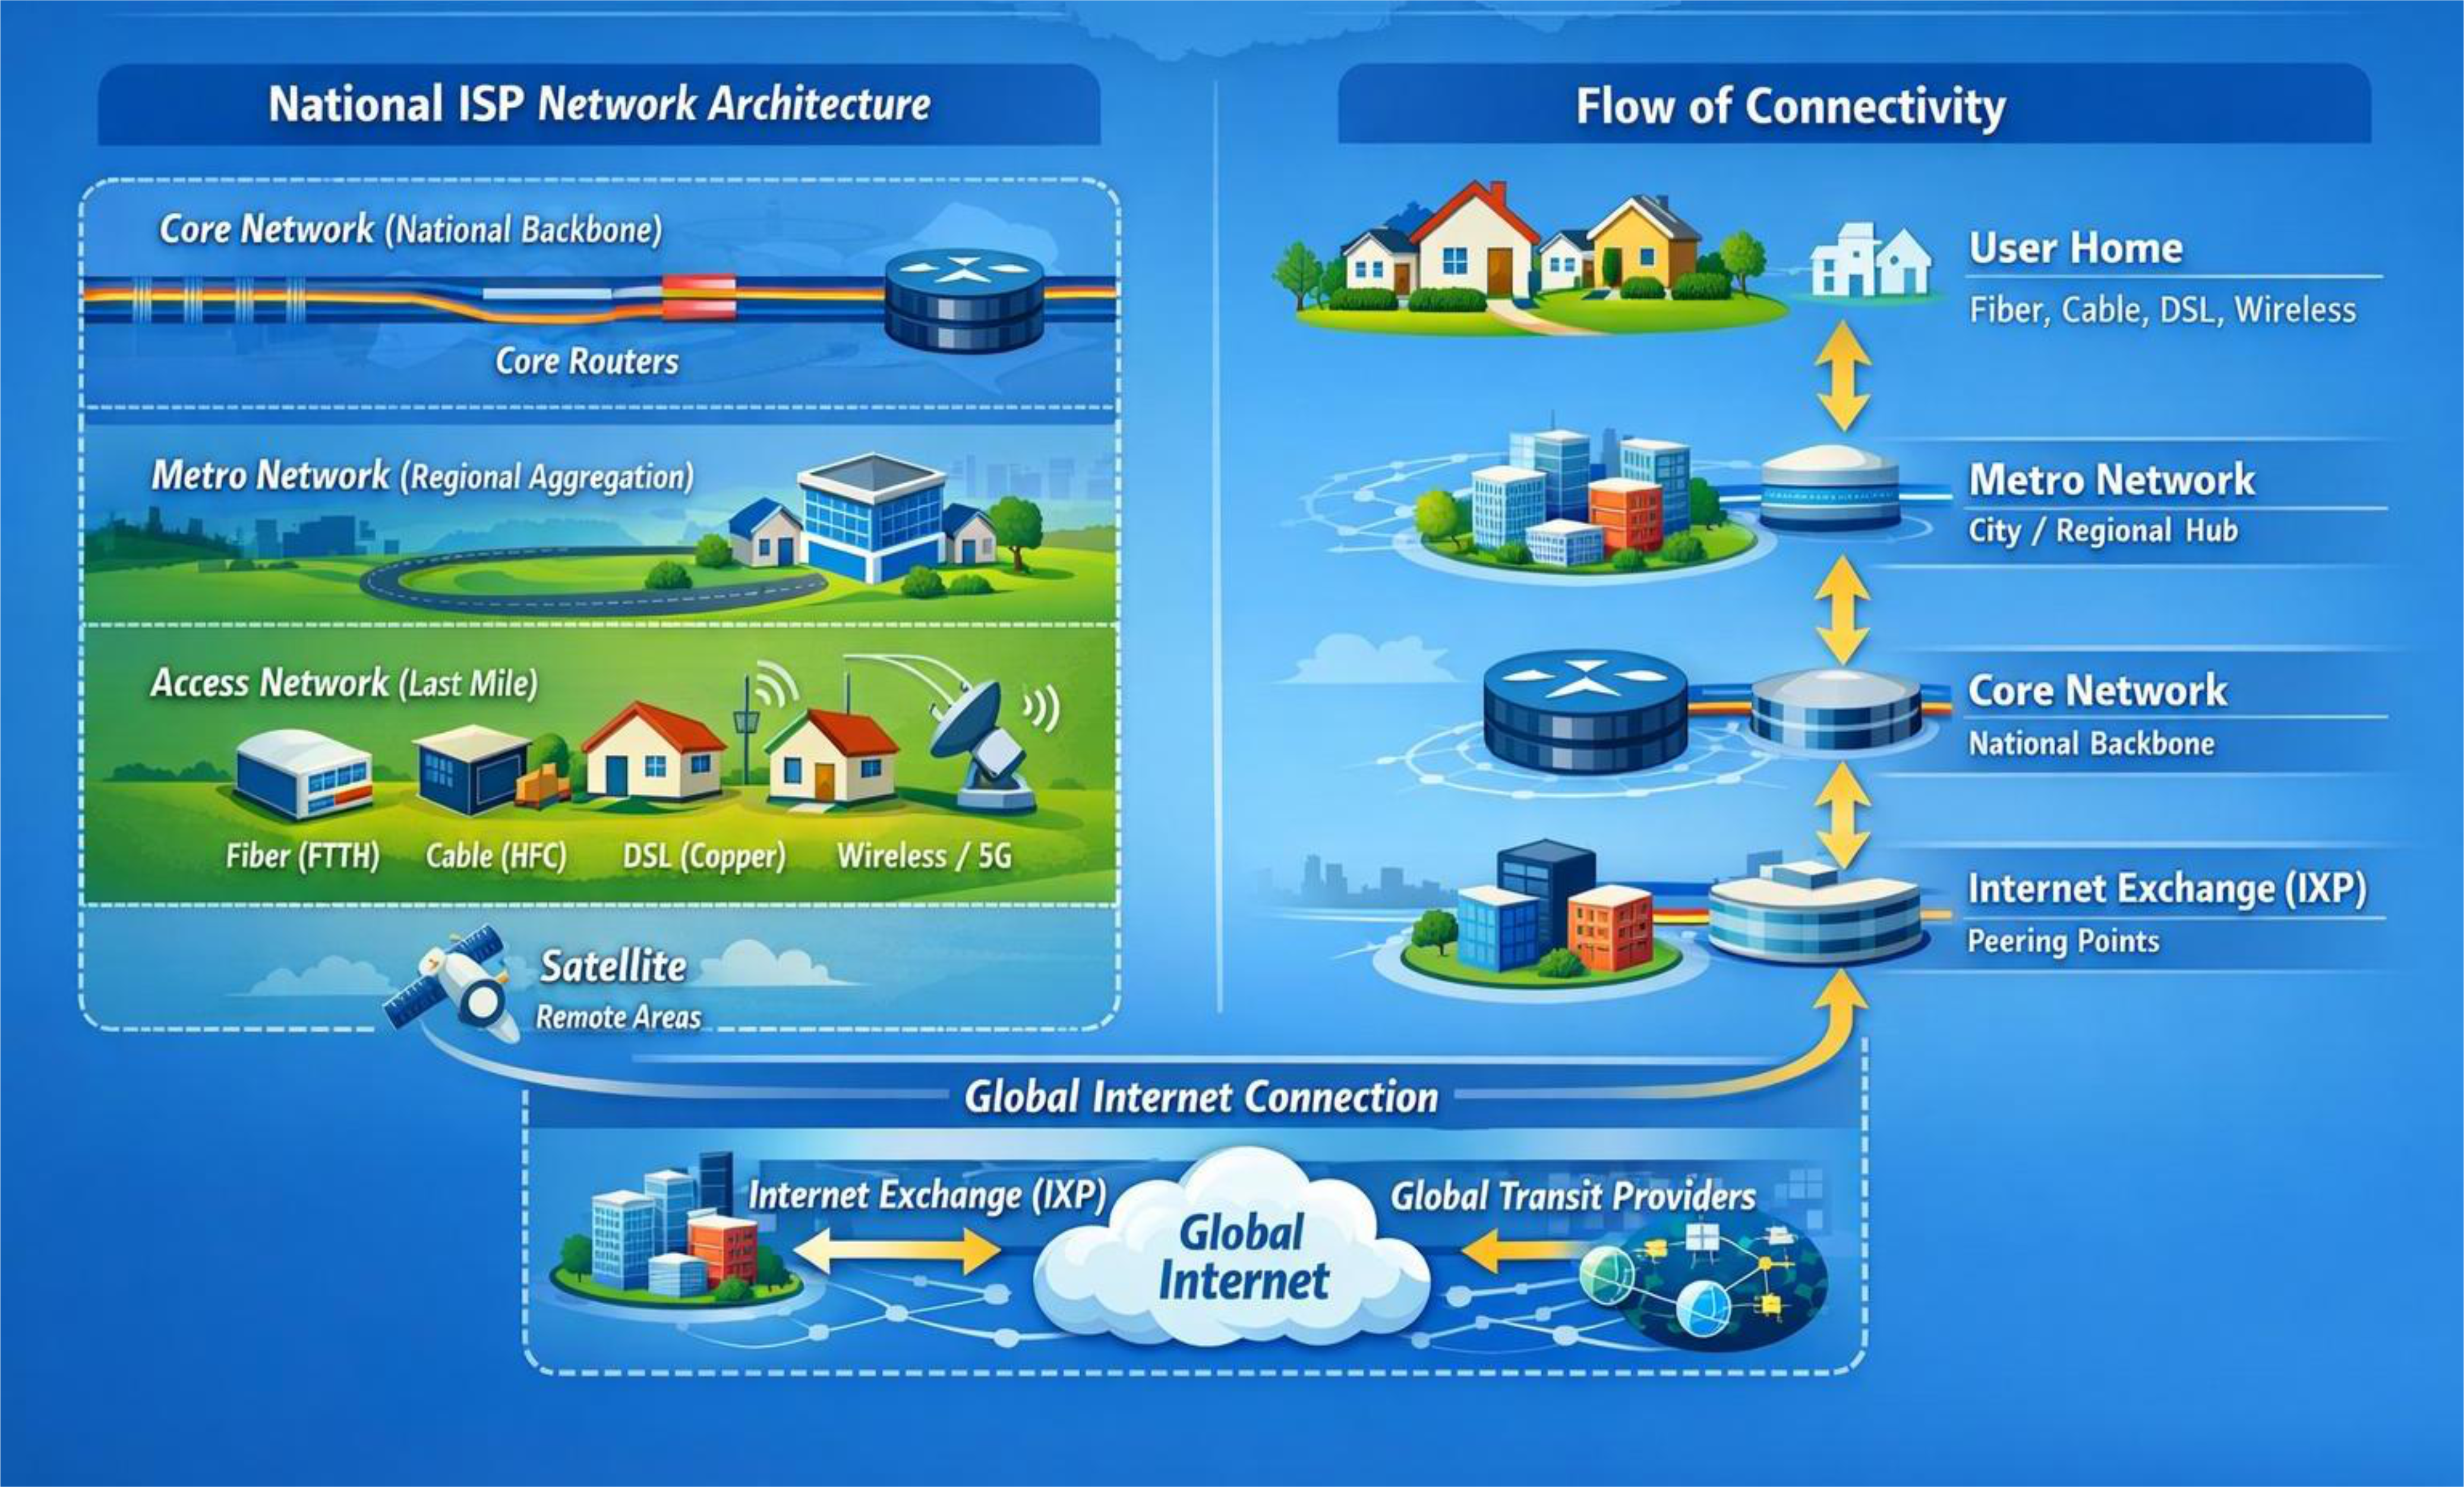
National ISP Network Architecture:
-
Core Network (National Backbone)
- Core Routers
-
Metro Network (Regional Aggregation)
- City / Regional Hub
-
Access Network (Last Mile)
- Fiber (FTTH)
- Cable (HFC)
- DSL (Copper)
- Wireless / 5G
- Satellite (Remote Areas)
Flow of Connectivity:
- User Home (Fiber, Cable, DSL, Wireless) → Metro Network → (using fibre optic) Core Network → Internet Exchange (IXP) → Global Internet
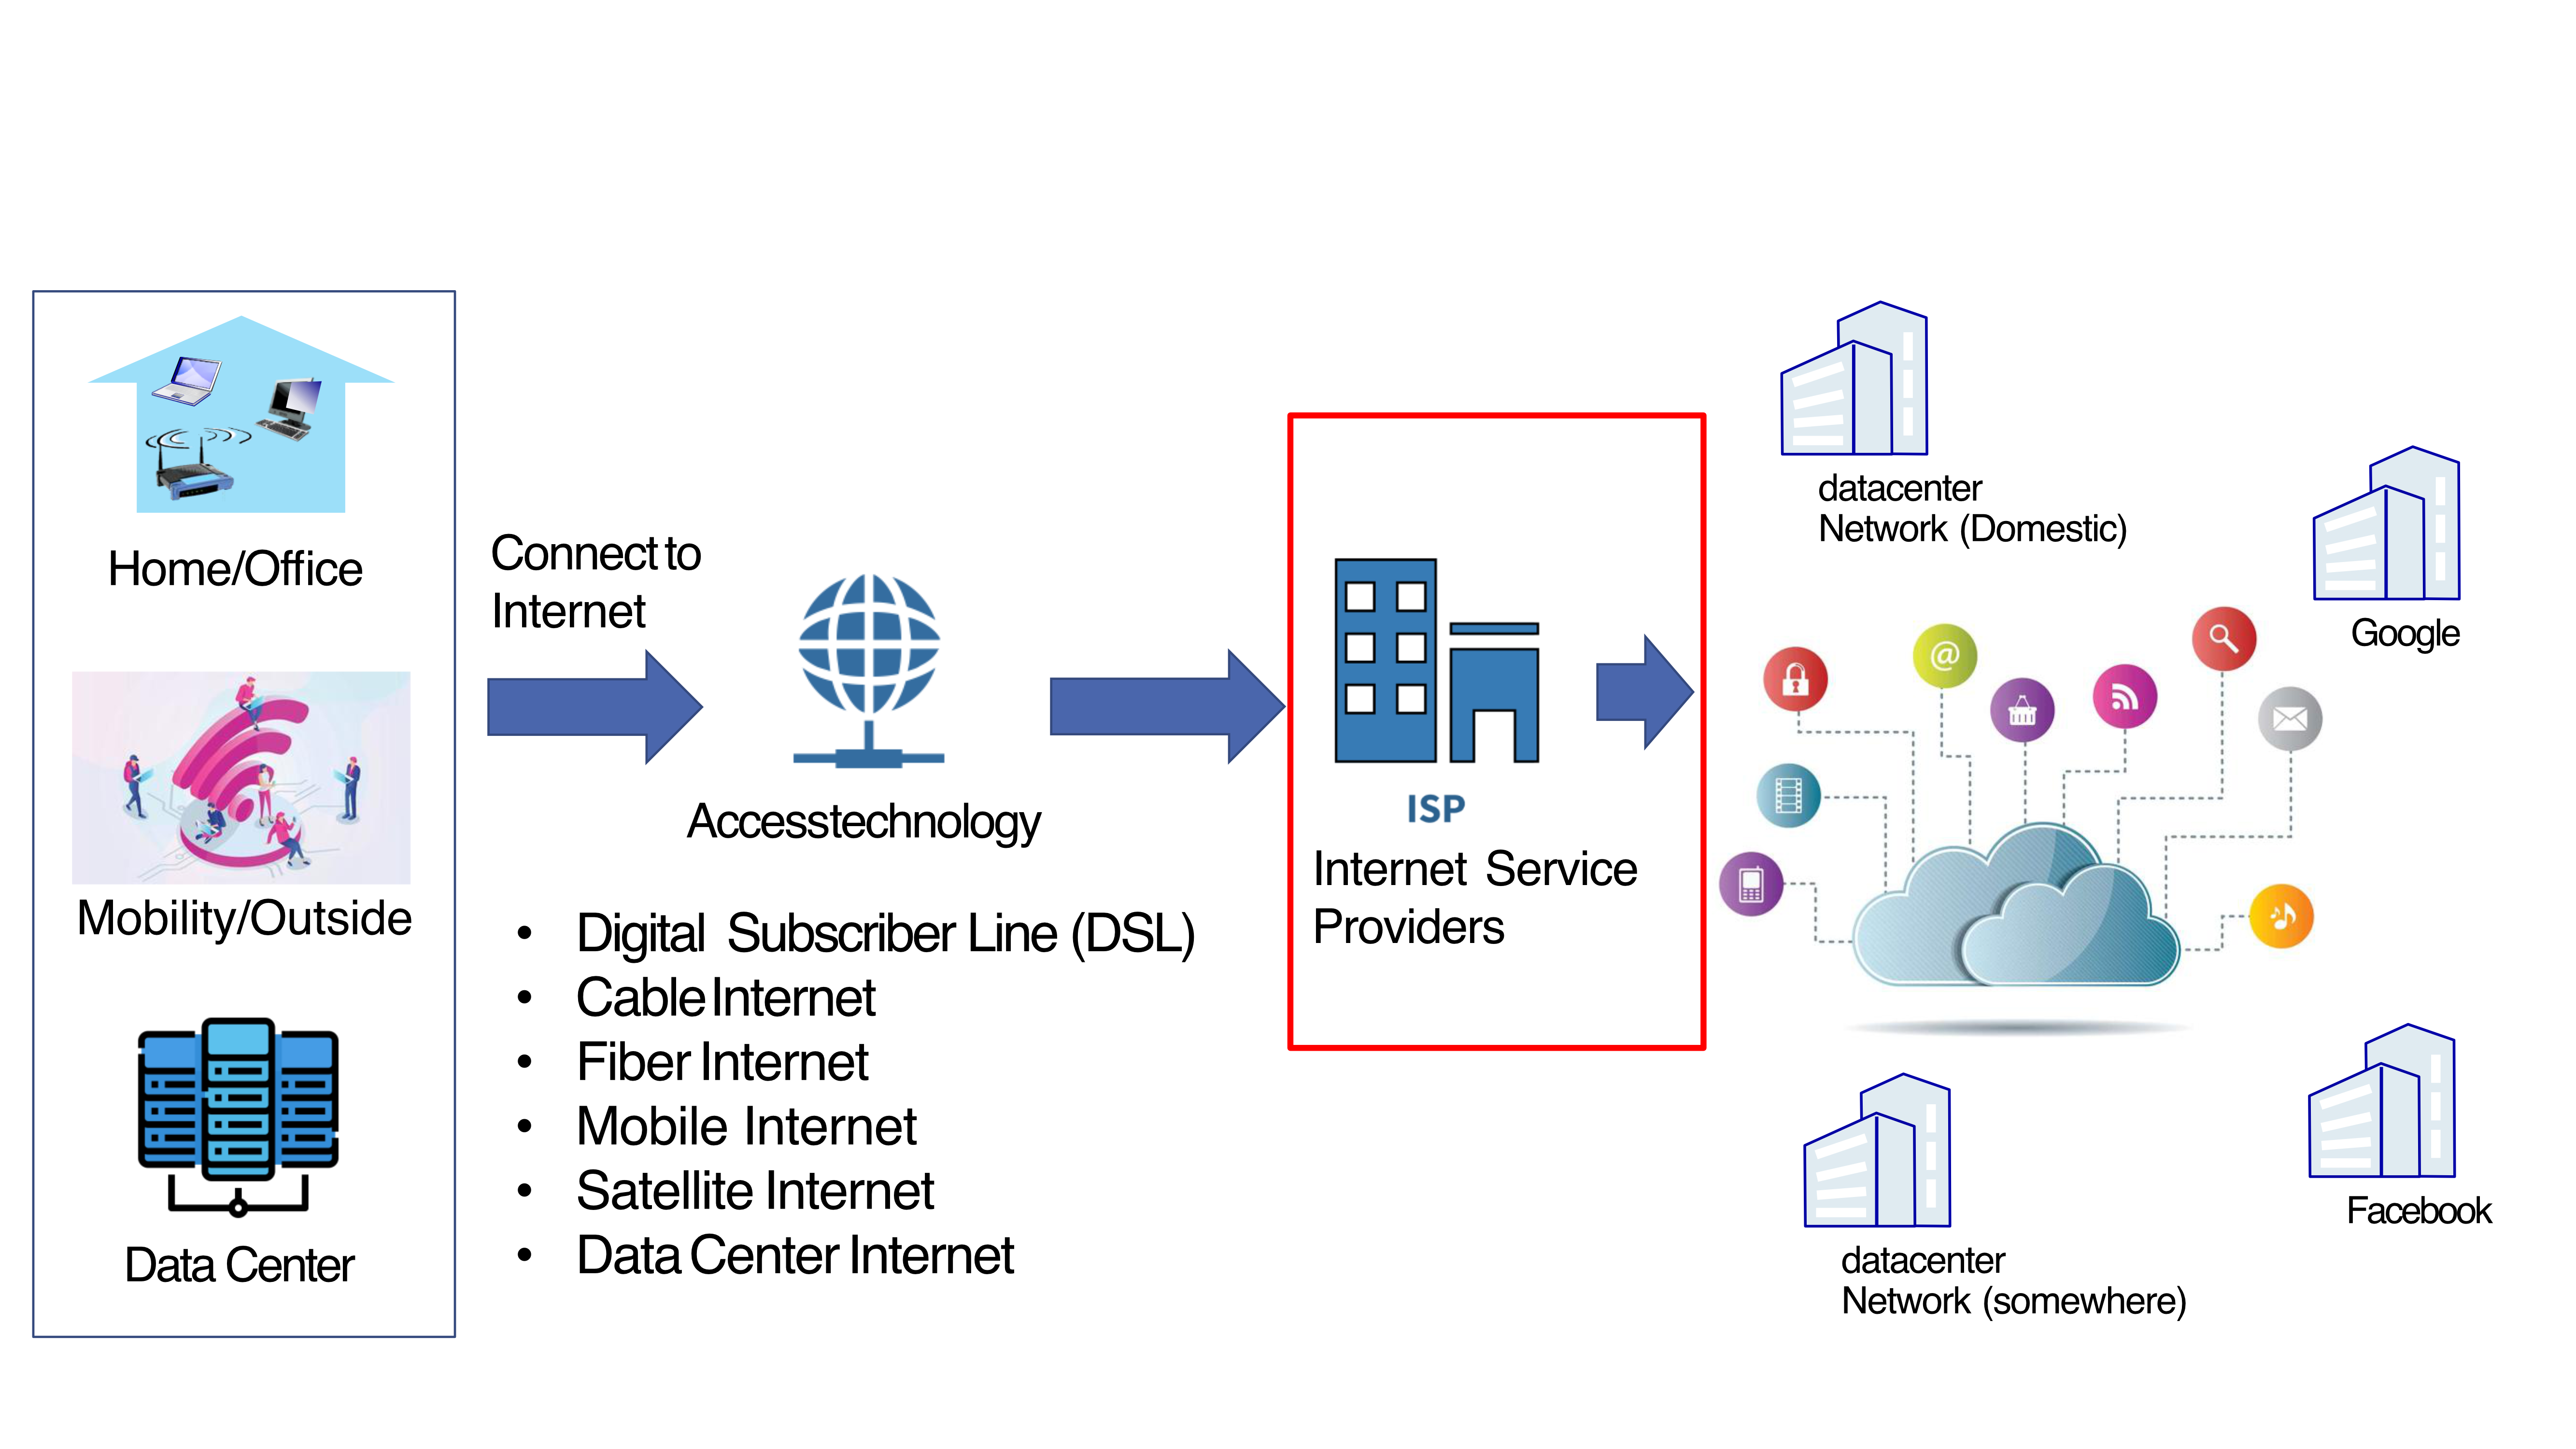
How to Access Internet
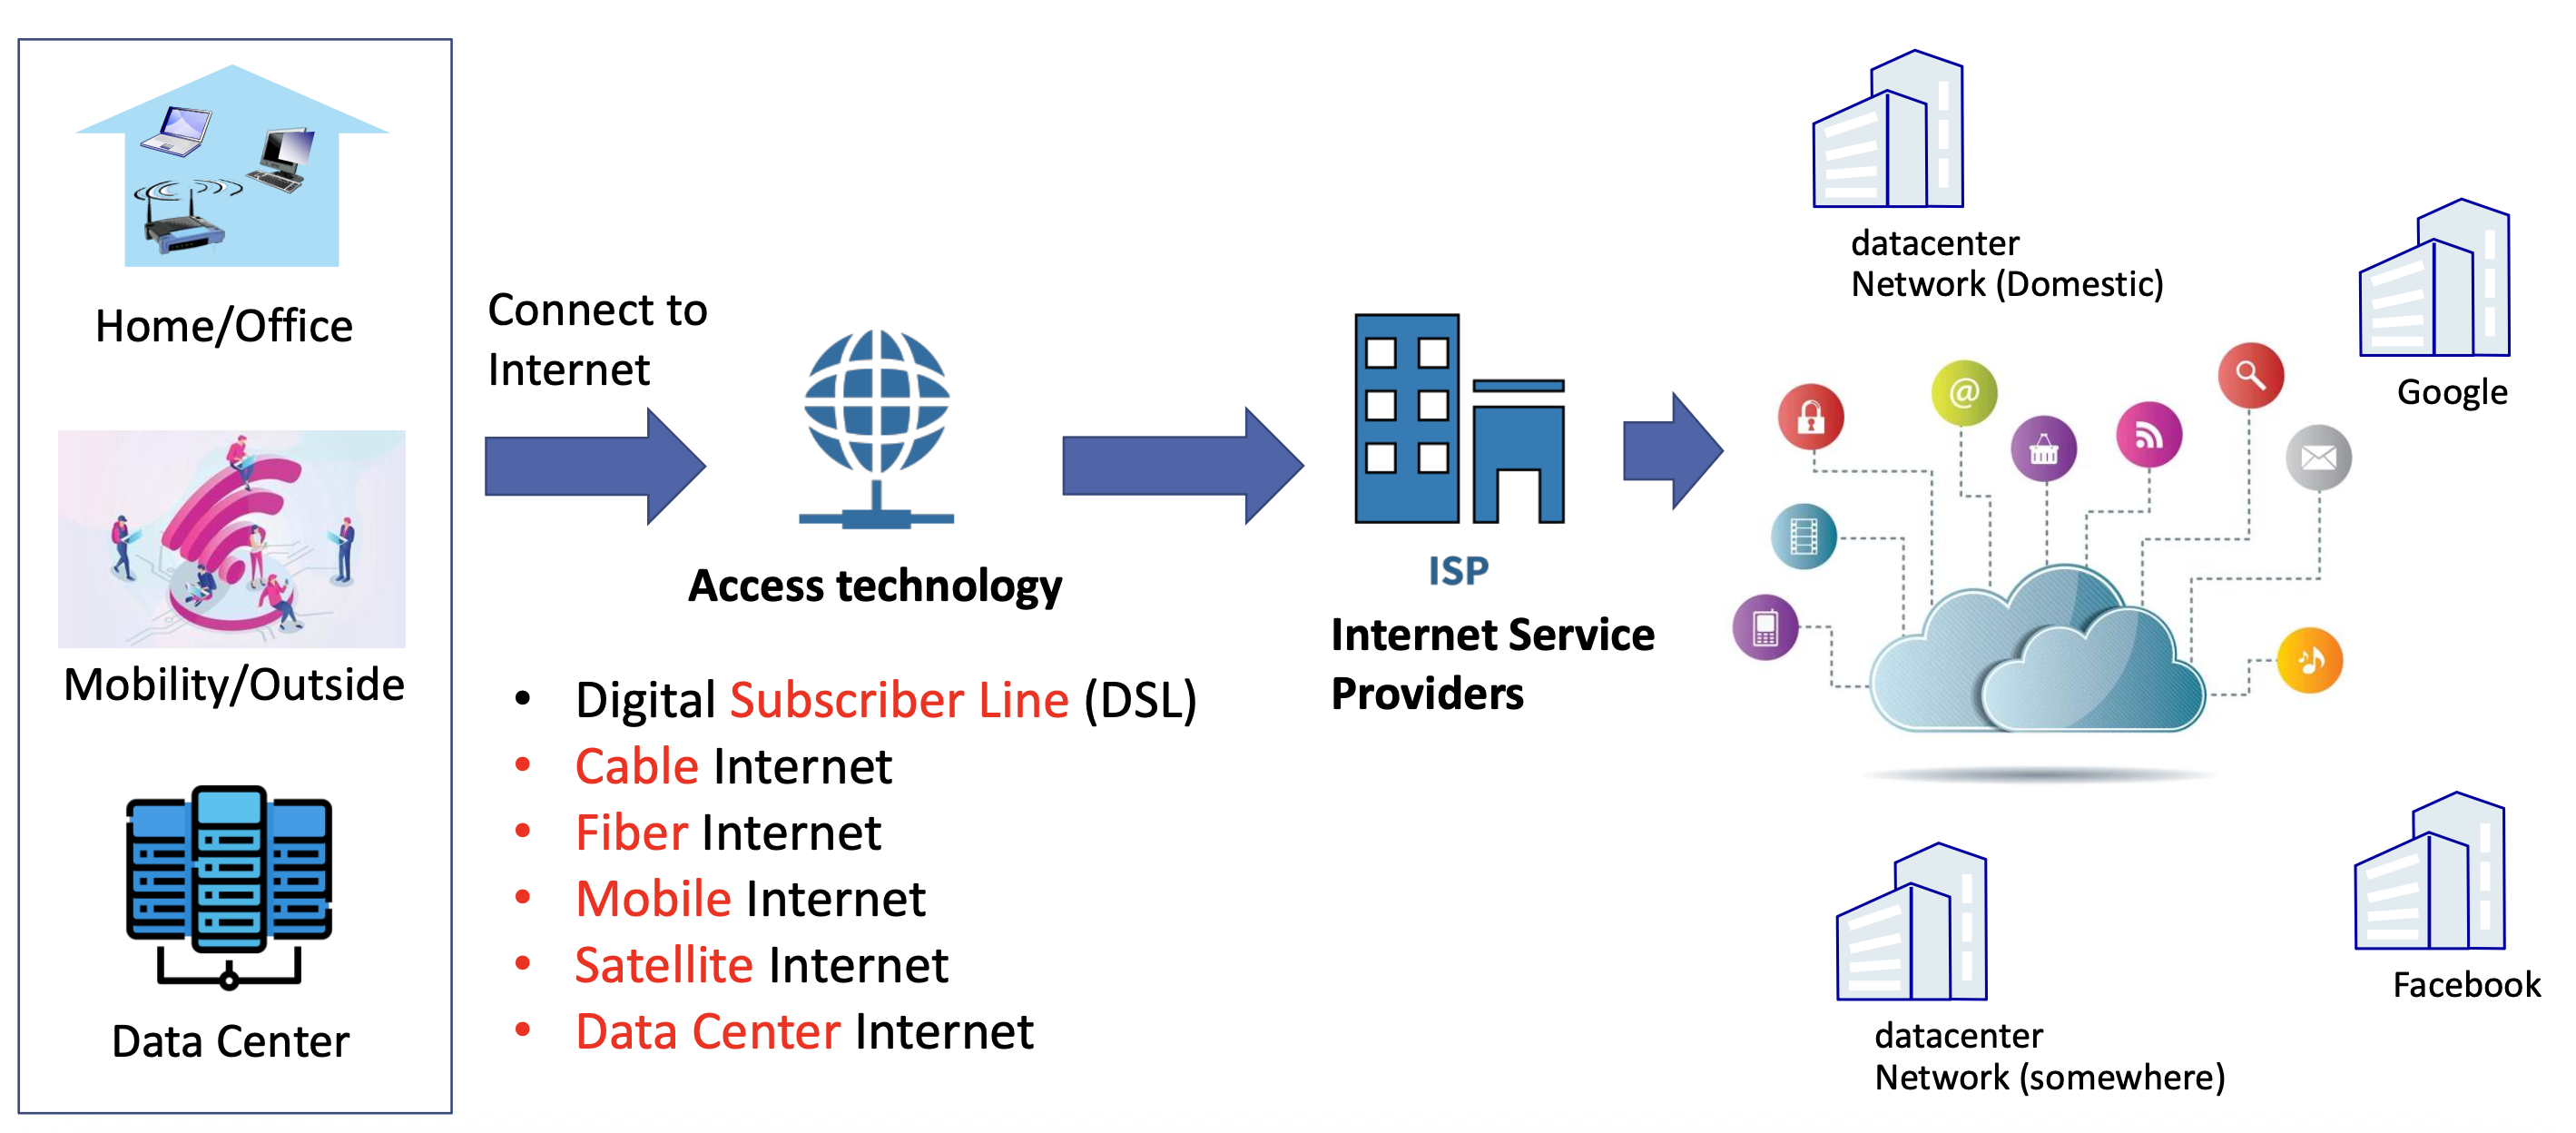
Access Technologies:
- Digital Subscriber Line (DSL)
- Cable Internet
- Fiber Internet
- Mobile Internet
- Satellite Internet
- Data Center Internet
Access Points:
- Home/Office
- Mobility/Outside
- Data Center
→ Connect to Internet → ISP (Internet Service Providers) → Data Centers (Domestic & Global)
Access Technologies Overview
Types of Access Technologies
- Digital Subscriber Line (DSL)
- Cable Internet
- Fiber Internet
- Wireless
- Mobile Internet (2G/2.75G (Edge)/3G/4G/5G)
- Satellite Internet (IP Star, Starlink)
- Data Center Internet
How to Select?
Consider these factors:
- Fixed or Portable (จะใช้ Internet ยังไง? อยู่กับที่ หรือ เคลื่อนที่ง่าย)
- Available technology in area
- Speed (50 MB/ 200 MB / 1 GB)
- Stability (24/7, full speed)
- Power Condition (Battery?)
- Environment (rain, thunderstorm)
- Usage Condition (Consumer, Commercial)
Consumer 500 Baht (ได้ 300 MB) - Enterprise: 5000 Baht (ก็ได้ 300 MB)
เป็นเรื่องของ Bandwidth?, บางที Enterprise ได้ Public IP
Digital Subscriber Line (DSL)
Overview
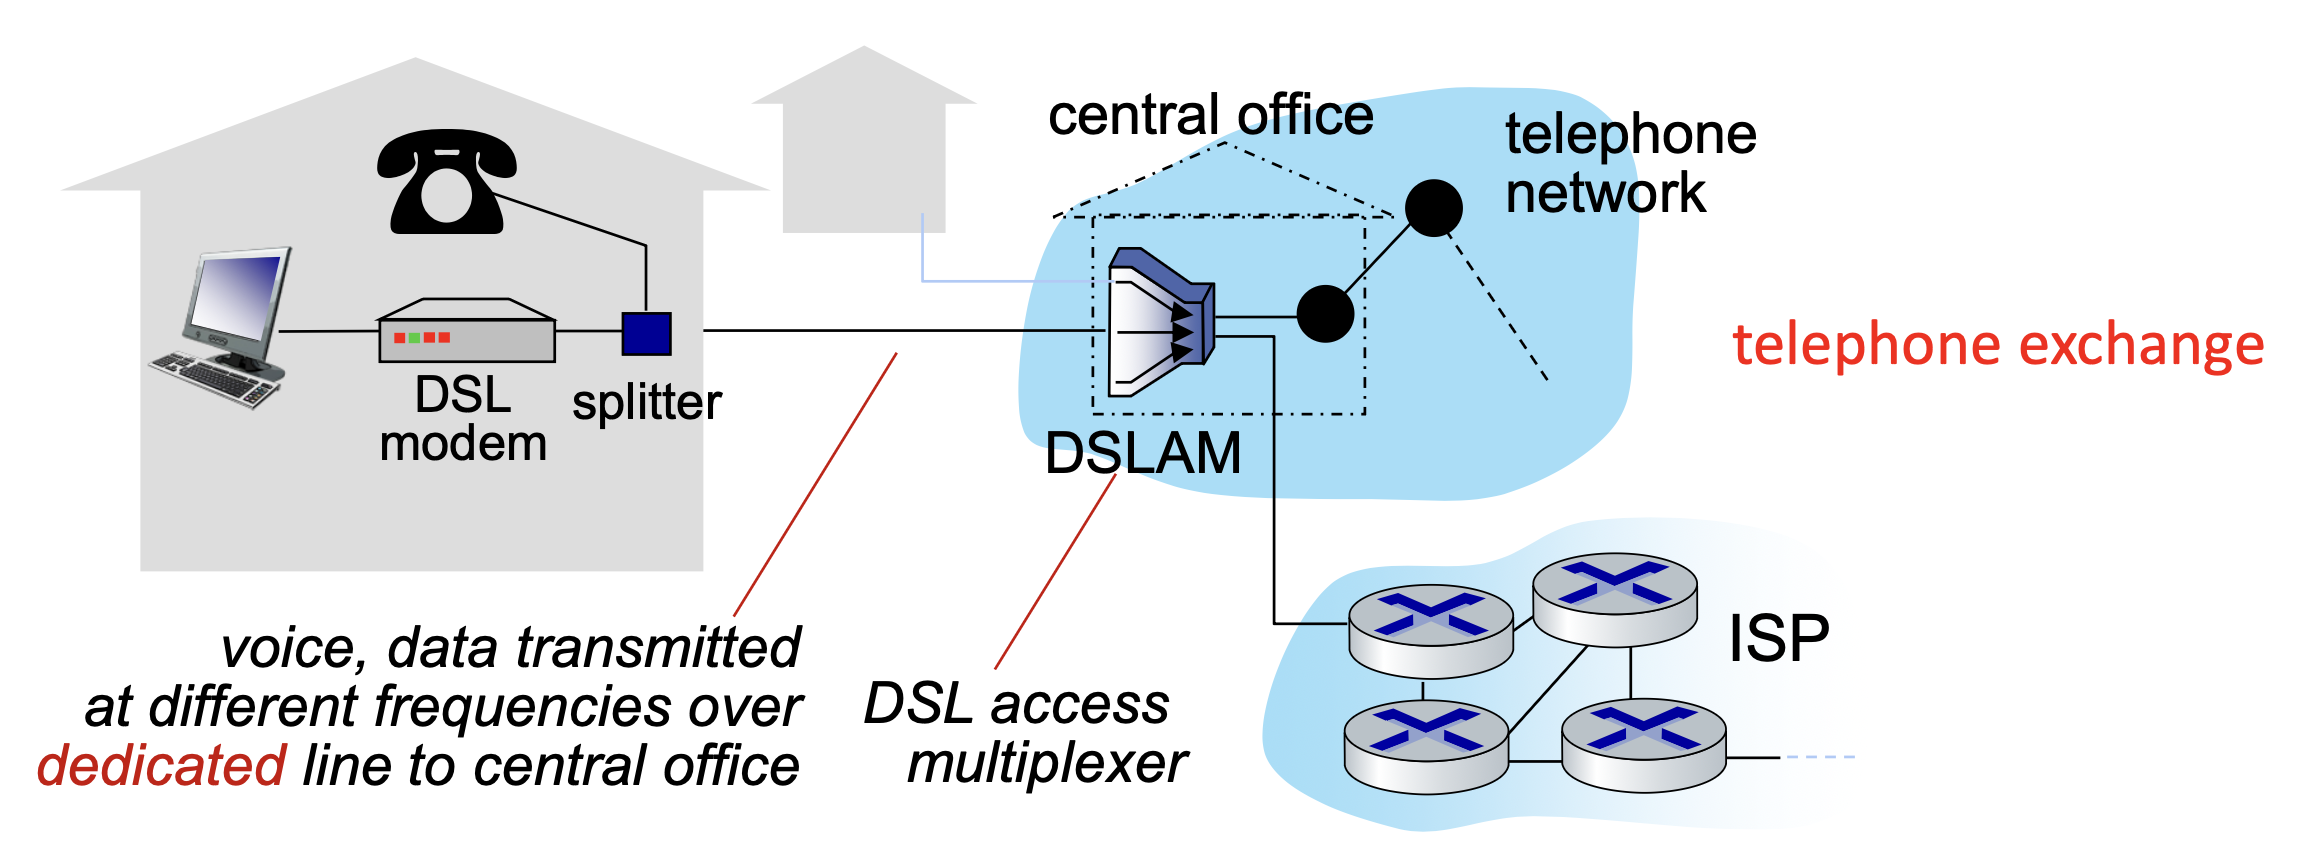
- Use existing telephone line to central office DSLAM (DSL Access Multiplexer)
- Data over DSL phone line goes to Internet
- Voice over DSL phone line goes to telephone net
- Voice, data transmitted at different frequencies over dedicated line to central office
Transmission Rates
- 24-52 Mbps dedicated downstream transmission rate
- 3.5-16 Mbps dedicated upstream transmission rate
Downstream ก็คือเหมือนจาก ISP (มองเป็น Server) ส่งเข้าหา Computer (Download)
Upstream ก็ตรงข้ามกัน เป็น เหมือน Uploading
Important Equipment
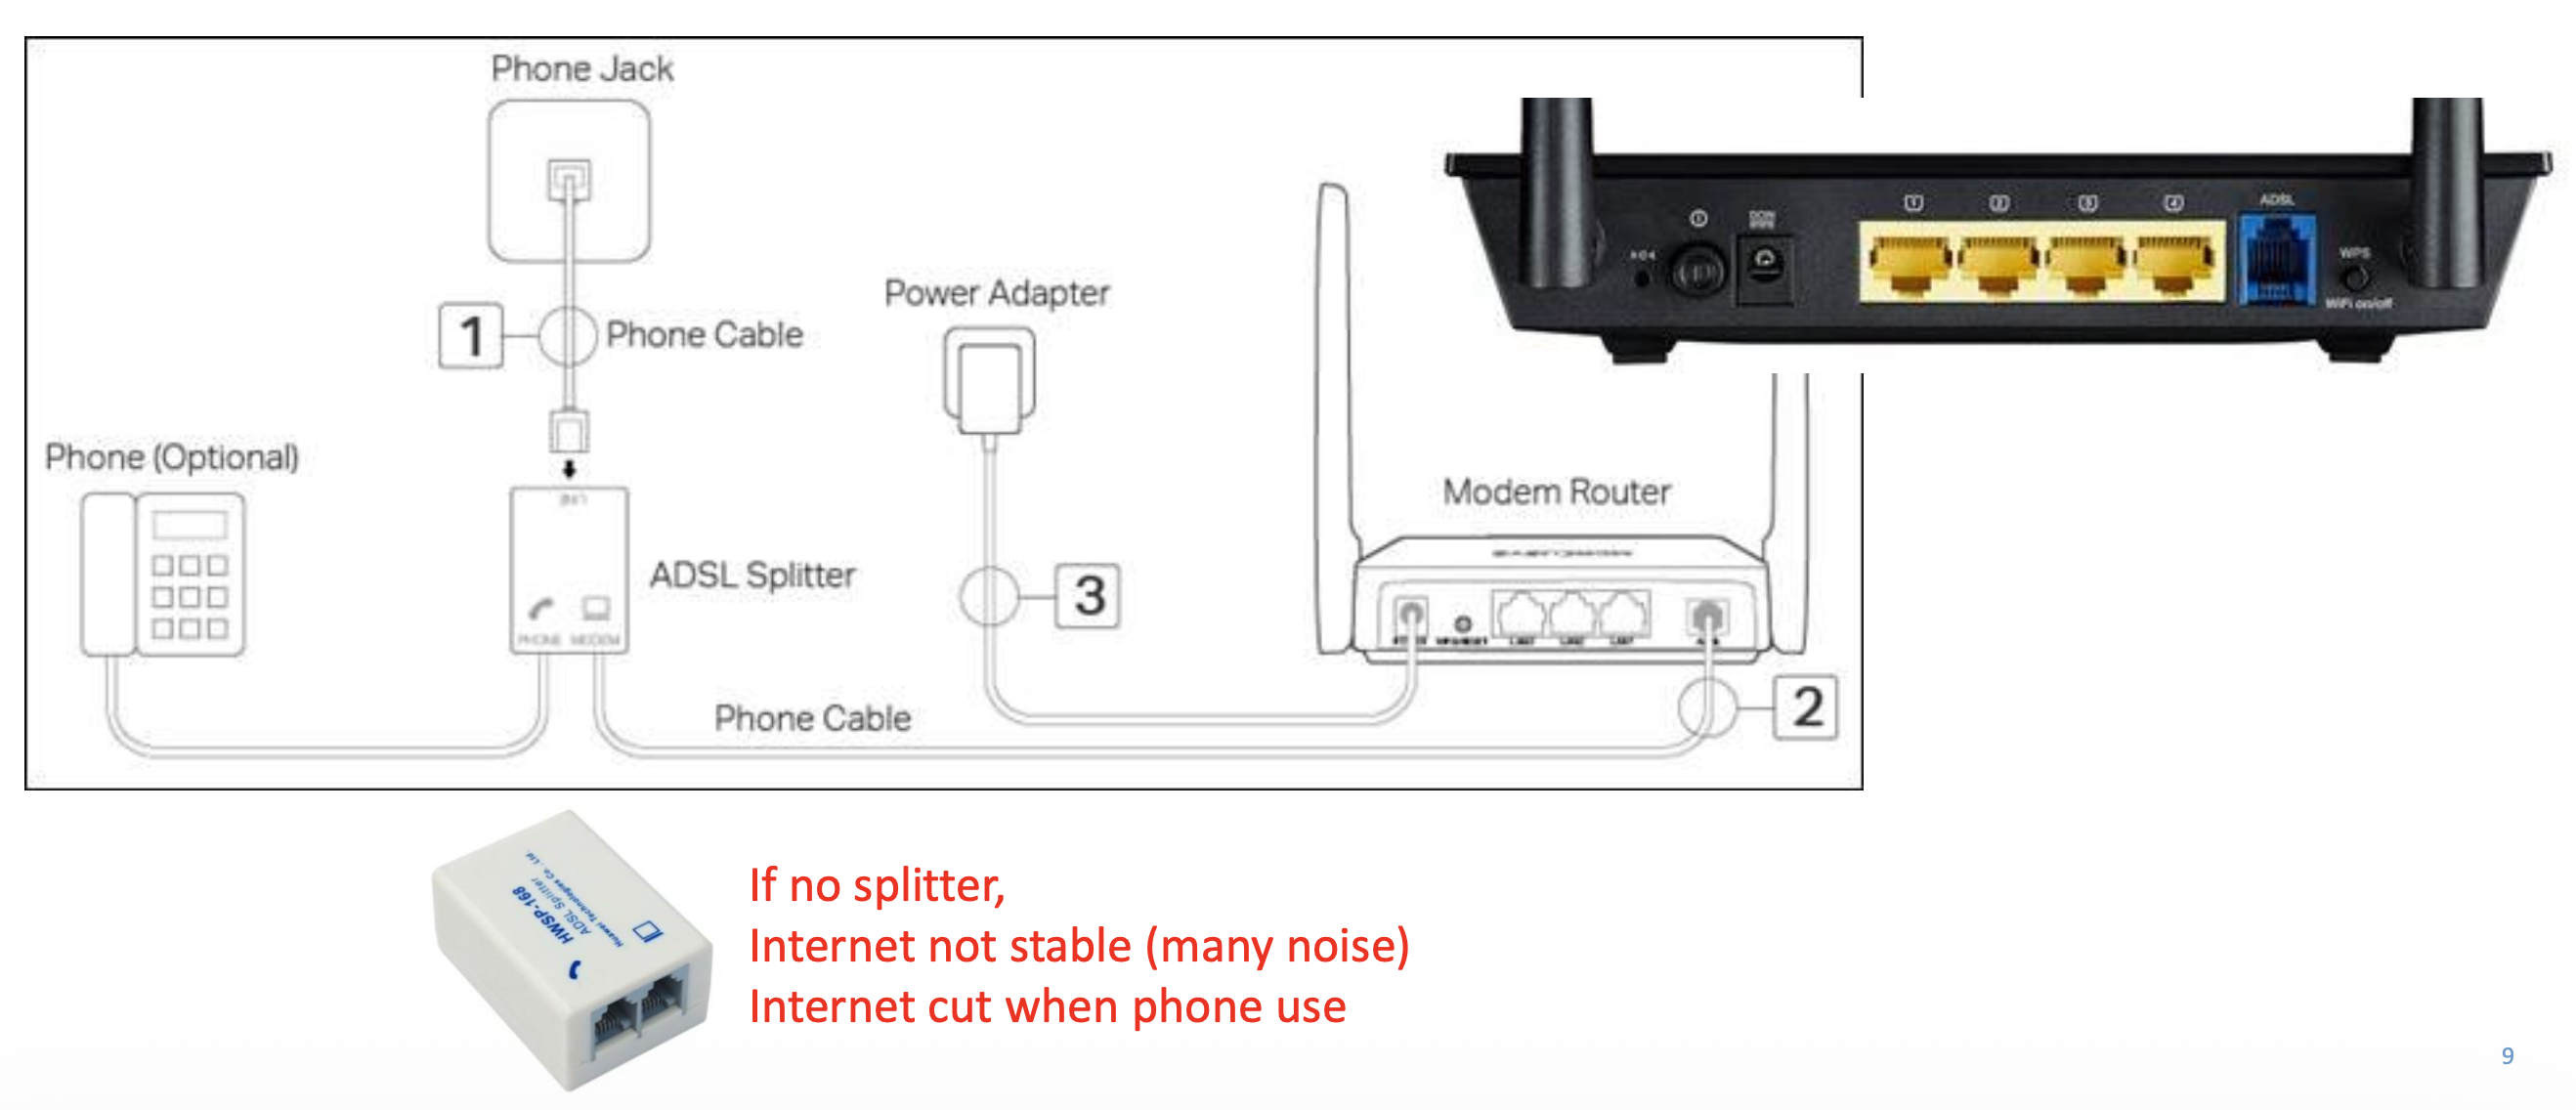
ทำไมตะก่อนต้องมี Modem + Router แยกกัน? แล้วตอนนี้กลายเป็น Modem Router แล้ว
Contents
Splitter is critical:
- If no splitter:
- Internet not stable (many noise)
- Internet cut when phone use
DSL Variants
| DSL Variant | Downstream Speed | Upstream Speed | Distance |
|---|---|---|---|
| ADSL | 512 Kbps to 2 Mbps | 256 Kbps | 5.5 km |
| ADSL2+ | 24 Mbps | 1 Mbps | 5 km |
| SHDSL | 192 Kbps to 2.3 Mbps | 192 Kbps to 2.3 Mbps | 4 km |
| VDSL | 15 Mbps | 15 Mbps | 1.5 km |
| VDSL2 | 100 Mbps | 100 Mbps | 1.5 km |
| Abbreviations: |
- ADSL - Asymmetric Digital Subscriber Line
- Connect your home to telephone exchange line???
- เดี๋ยวนี้ในกรุงเทพไม่ค่อยใช้กันแล้ว
- SHDSL - Single-pair High-speed Digital Subscriber Line
- VDSL - Very High Bit-rate Digital Subscriber Line
- Commonly used in condominium,
- Distance ก็น้อยลงมาหน่อย แต่ว่าไวขึ้น
Analogy: Think of DSL like using the same road for both cars (voice) and bikes (data). The splitter is like a traffic separator that keeps them from interfering with each other.
Cable-Based Access
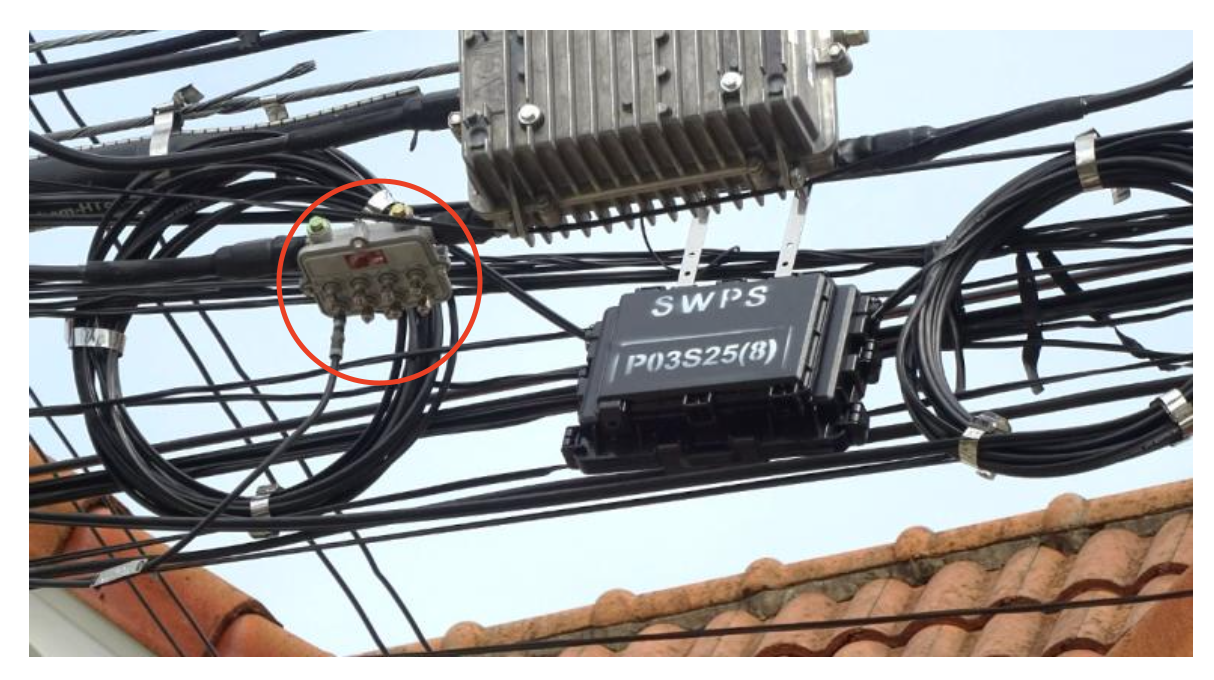
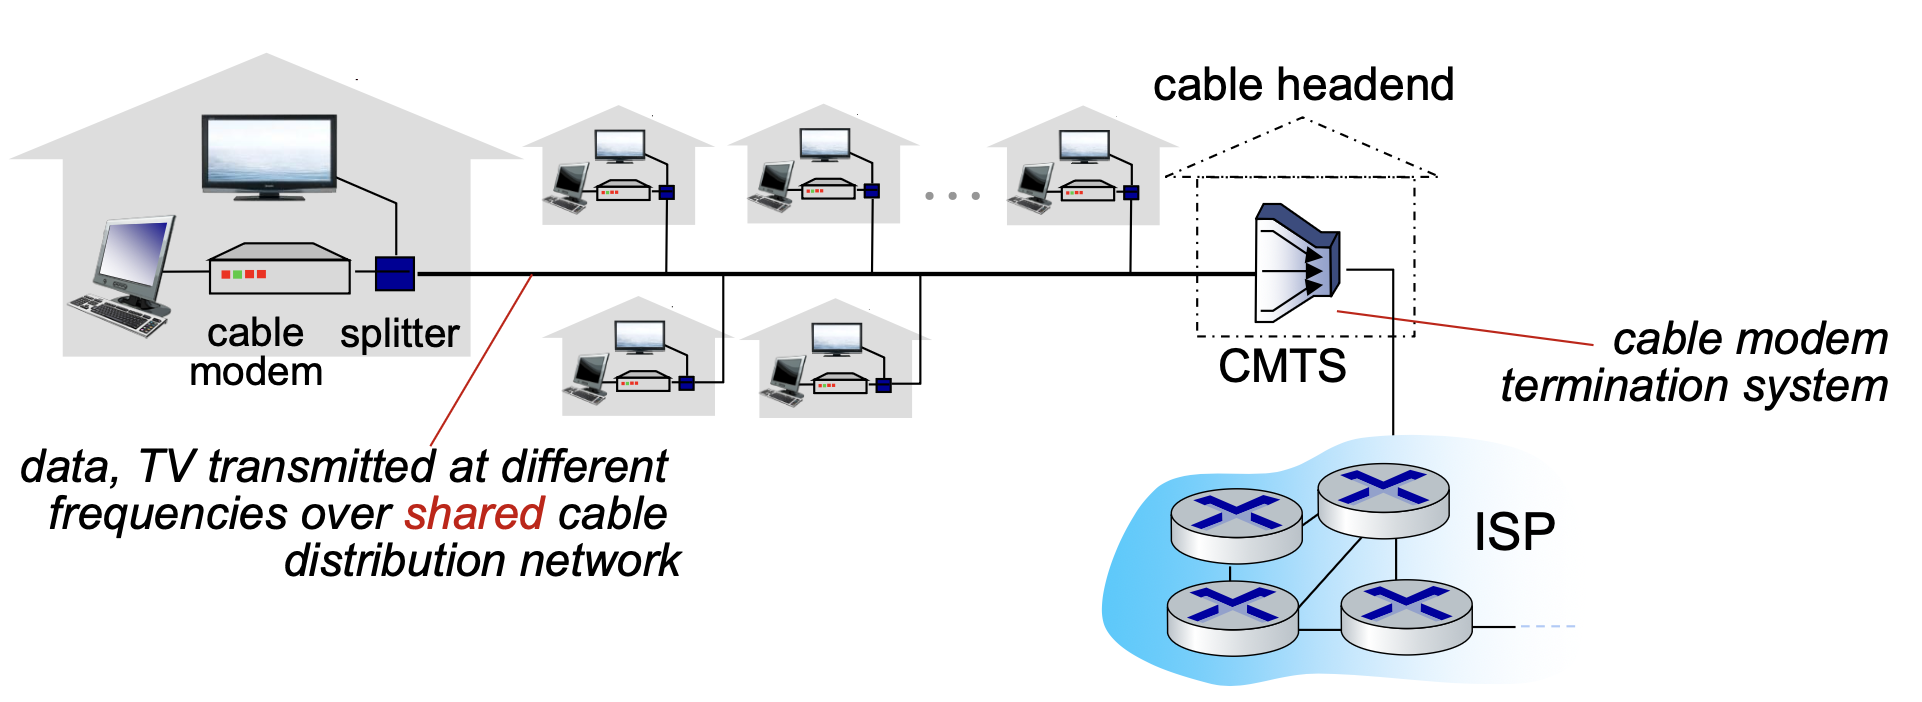
Hybrid Fiber Coax (HFC)
- Network of cable, fiber attaches homes to ISP router
- Homes share access network to cable headend
- Data, TV transmitted at different frequencies over shared cable distribution network
Transmission Rates
- Asymmetric:
- 40 Mbps – 1.2 Gbps downstream transmission rate
- 30-100 Mbps upstream transmission rate
Equipment
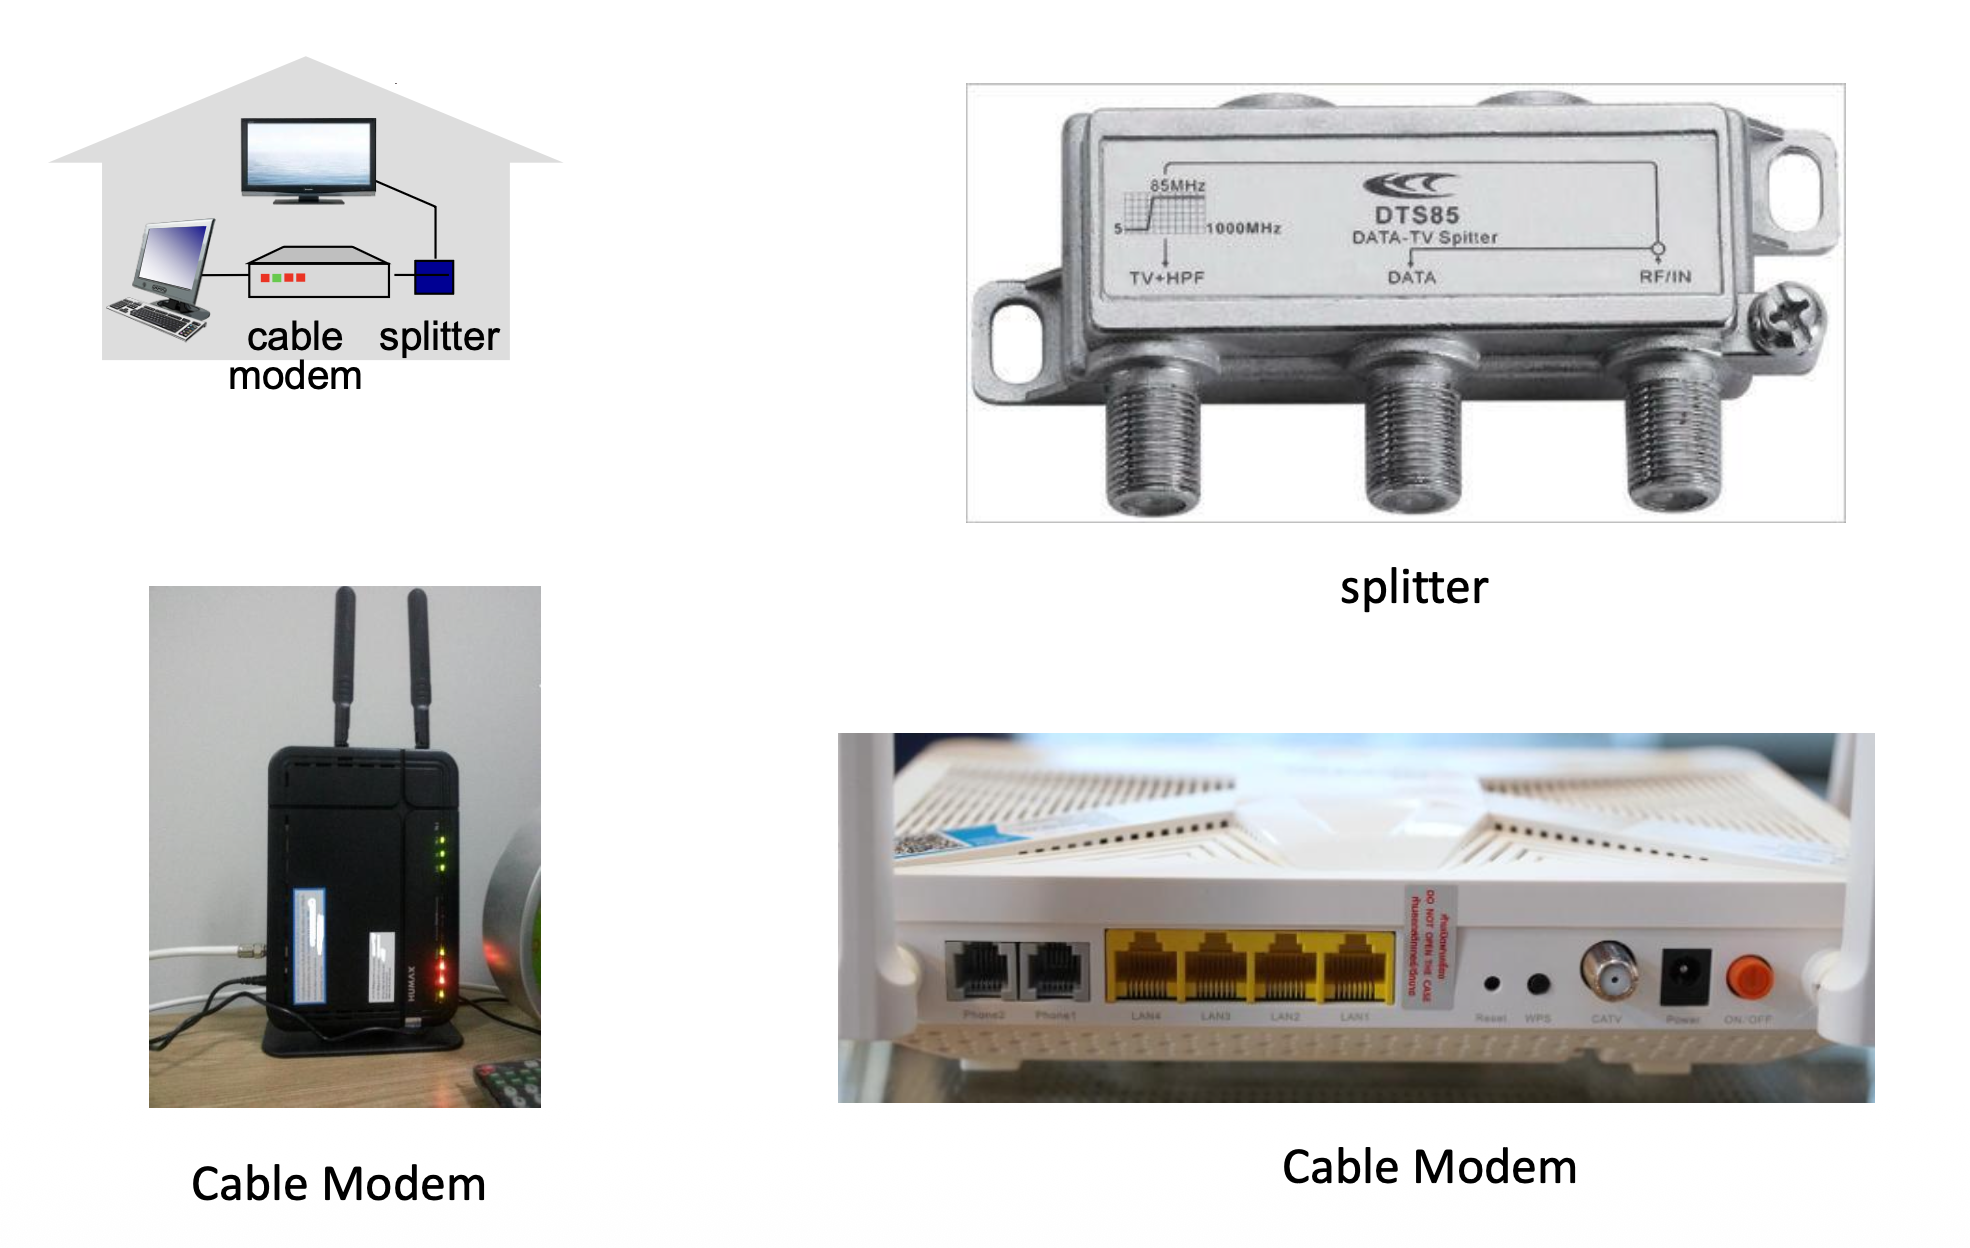
Analogy: Cable internet is like a highway shared by many cars (users). During rush hour (evening), it might slow down because everyone is using it at once.
Fiber-Based Access (FTTx)
Image: Fiber optic installation showing ONT (Optical Network Terminal), router, and wall outlet
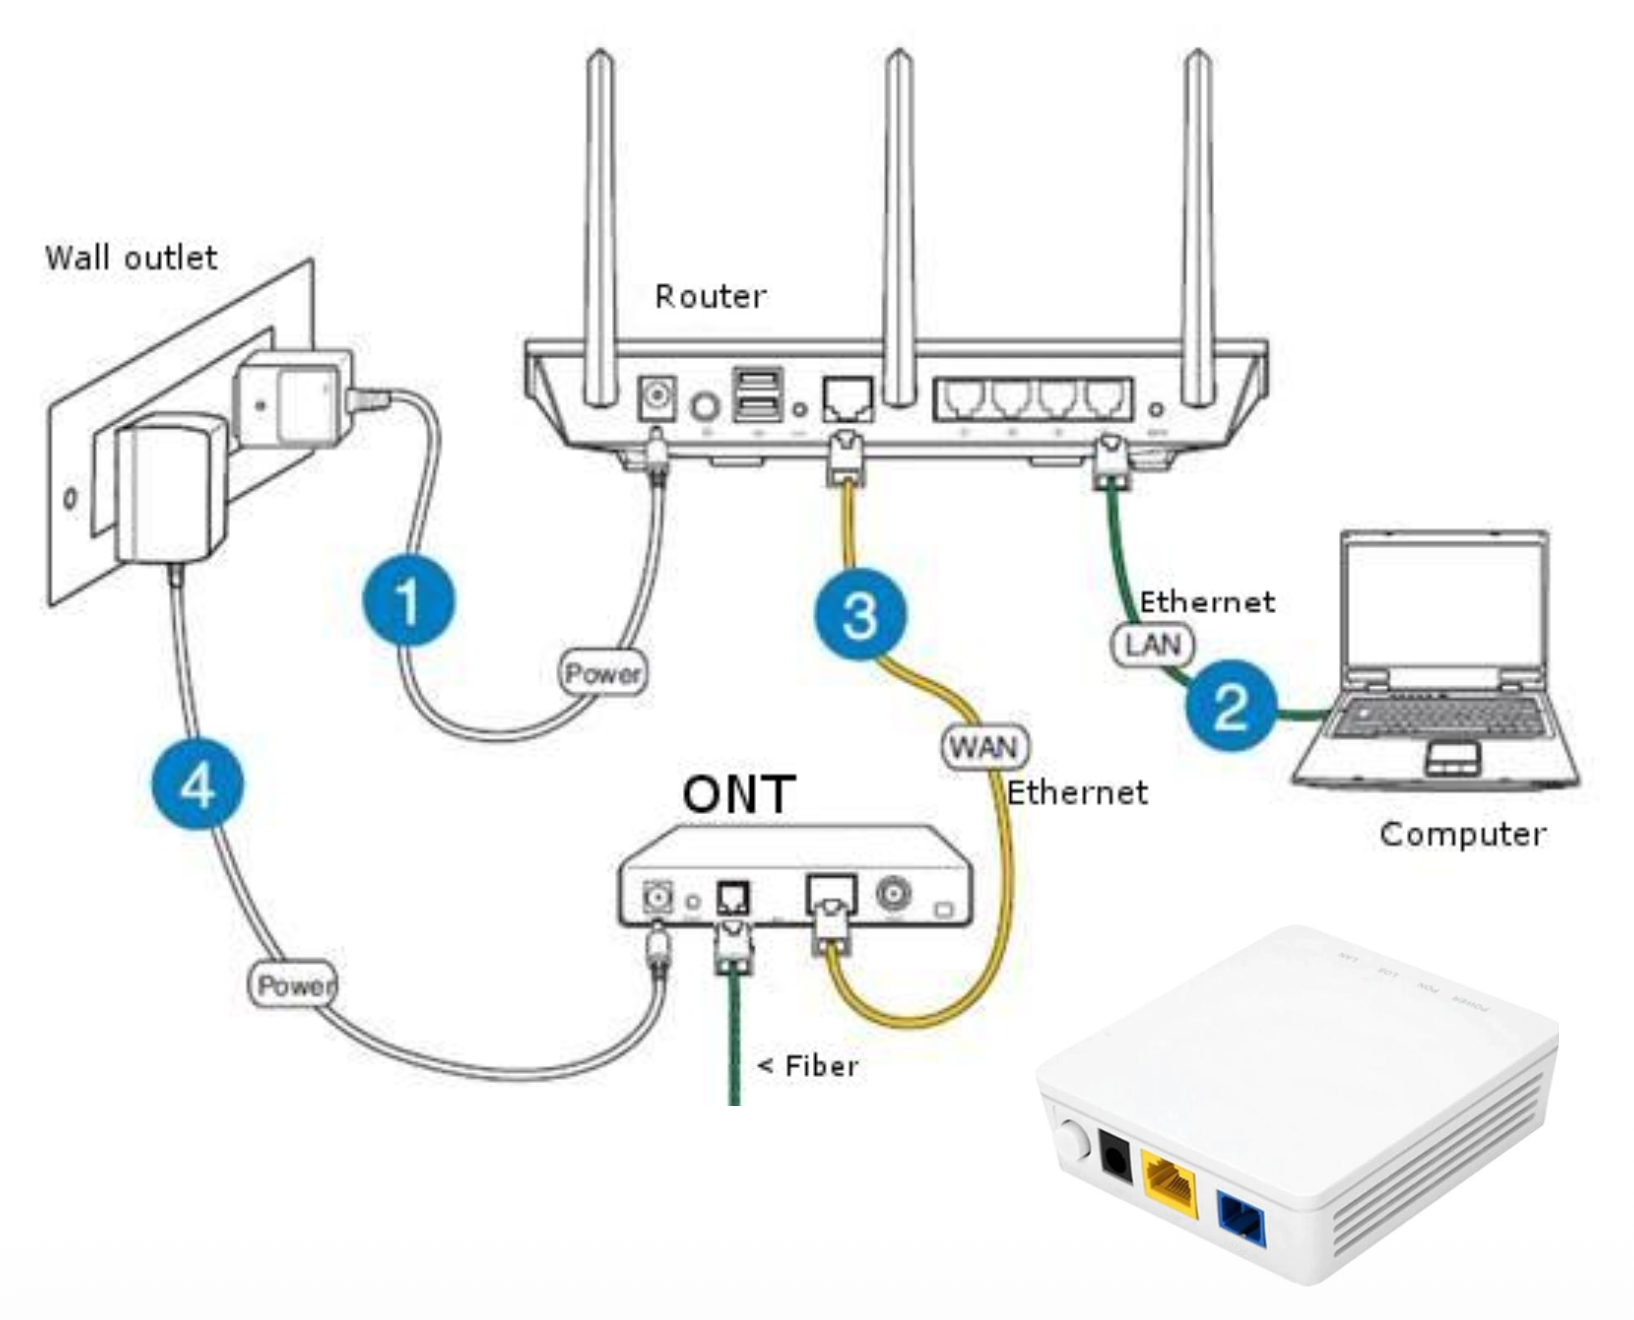
Advantages
- High-speed operation:
- High-speed point-to-point transmission (10's-100's Gbps)
- Low error rate:
- Repeaters spaced far apart
- Immune to electromagnetic noise
Fiber to the X (FTTx) Types
Image: FTTx network topology showing DSLAM, OLT (Optical Line Terminal), Mini-DSLAM, splitters, and ONTs
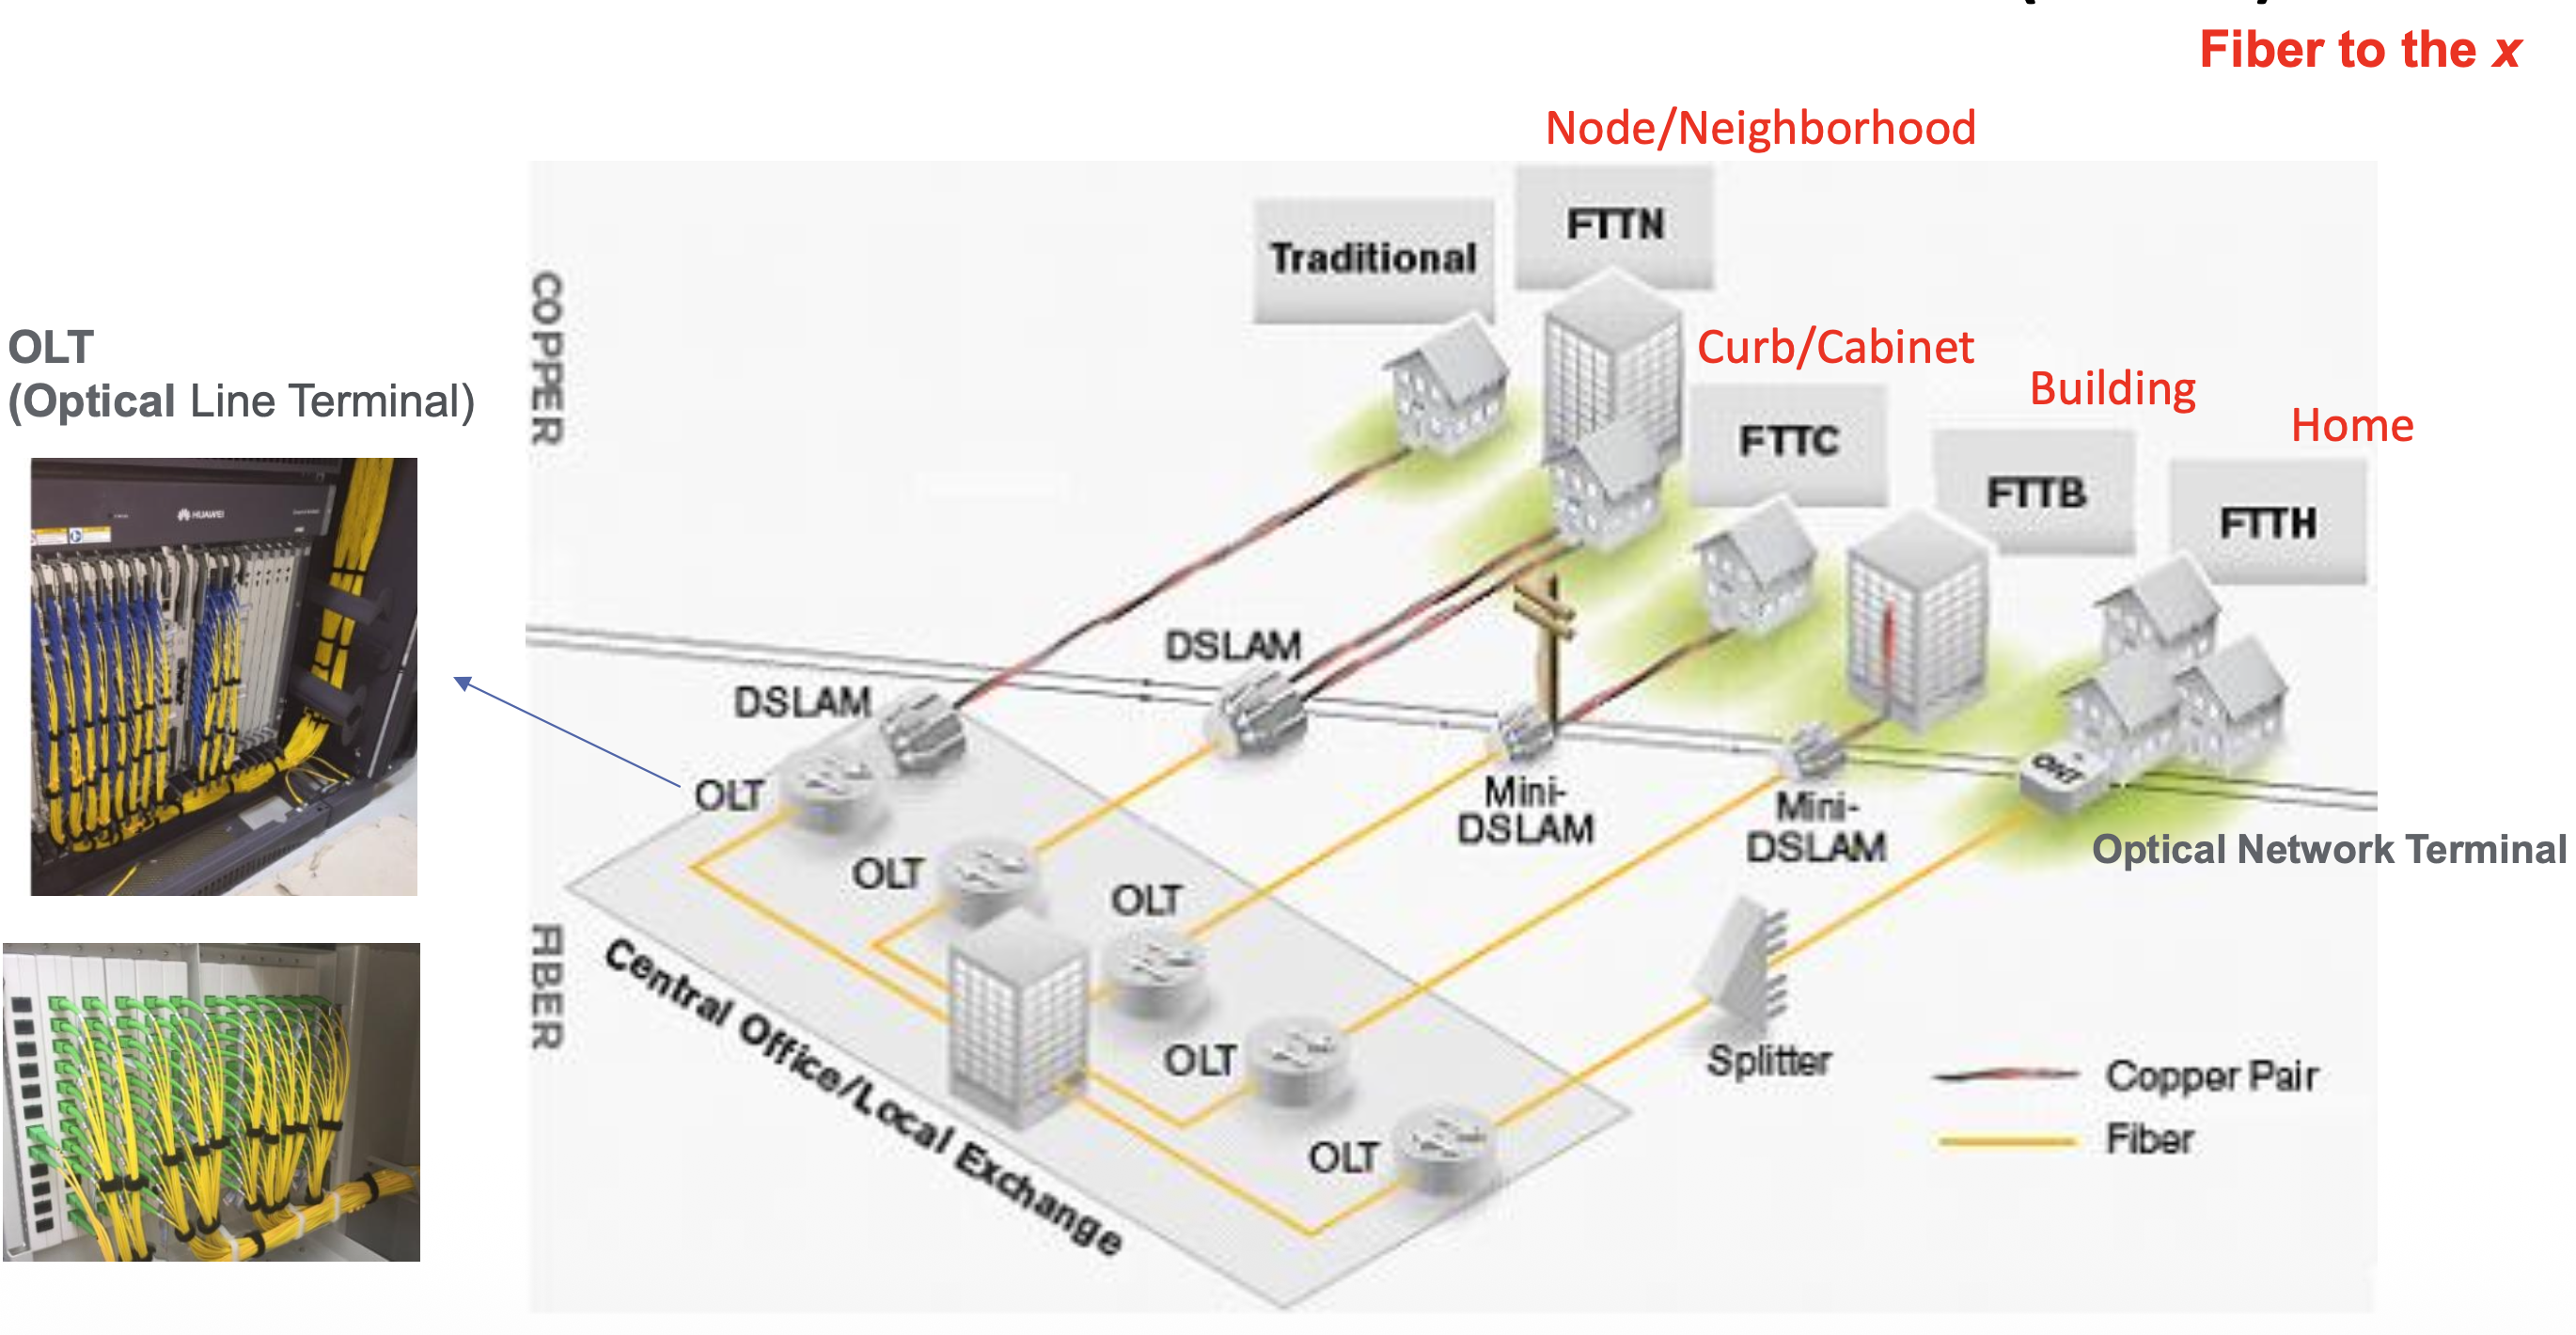
X can be:
- Home - FTTH (Fiber to the Home)
- Building - FTTB (Fiber to the Building)
- Curb/Cabinet - FTTC (Fiber to the Curb)
- Node/Neighborhood - FTTN (Fiber to the Node)
Infrastructure Components
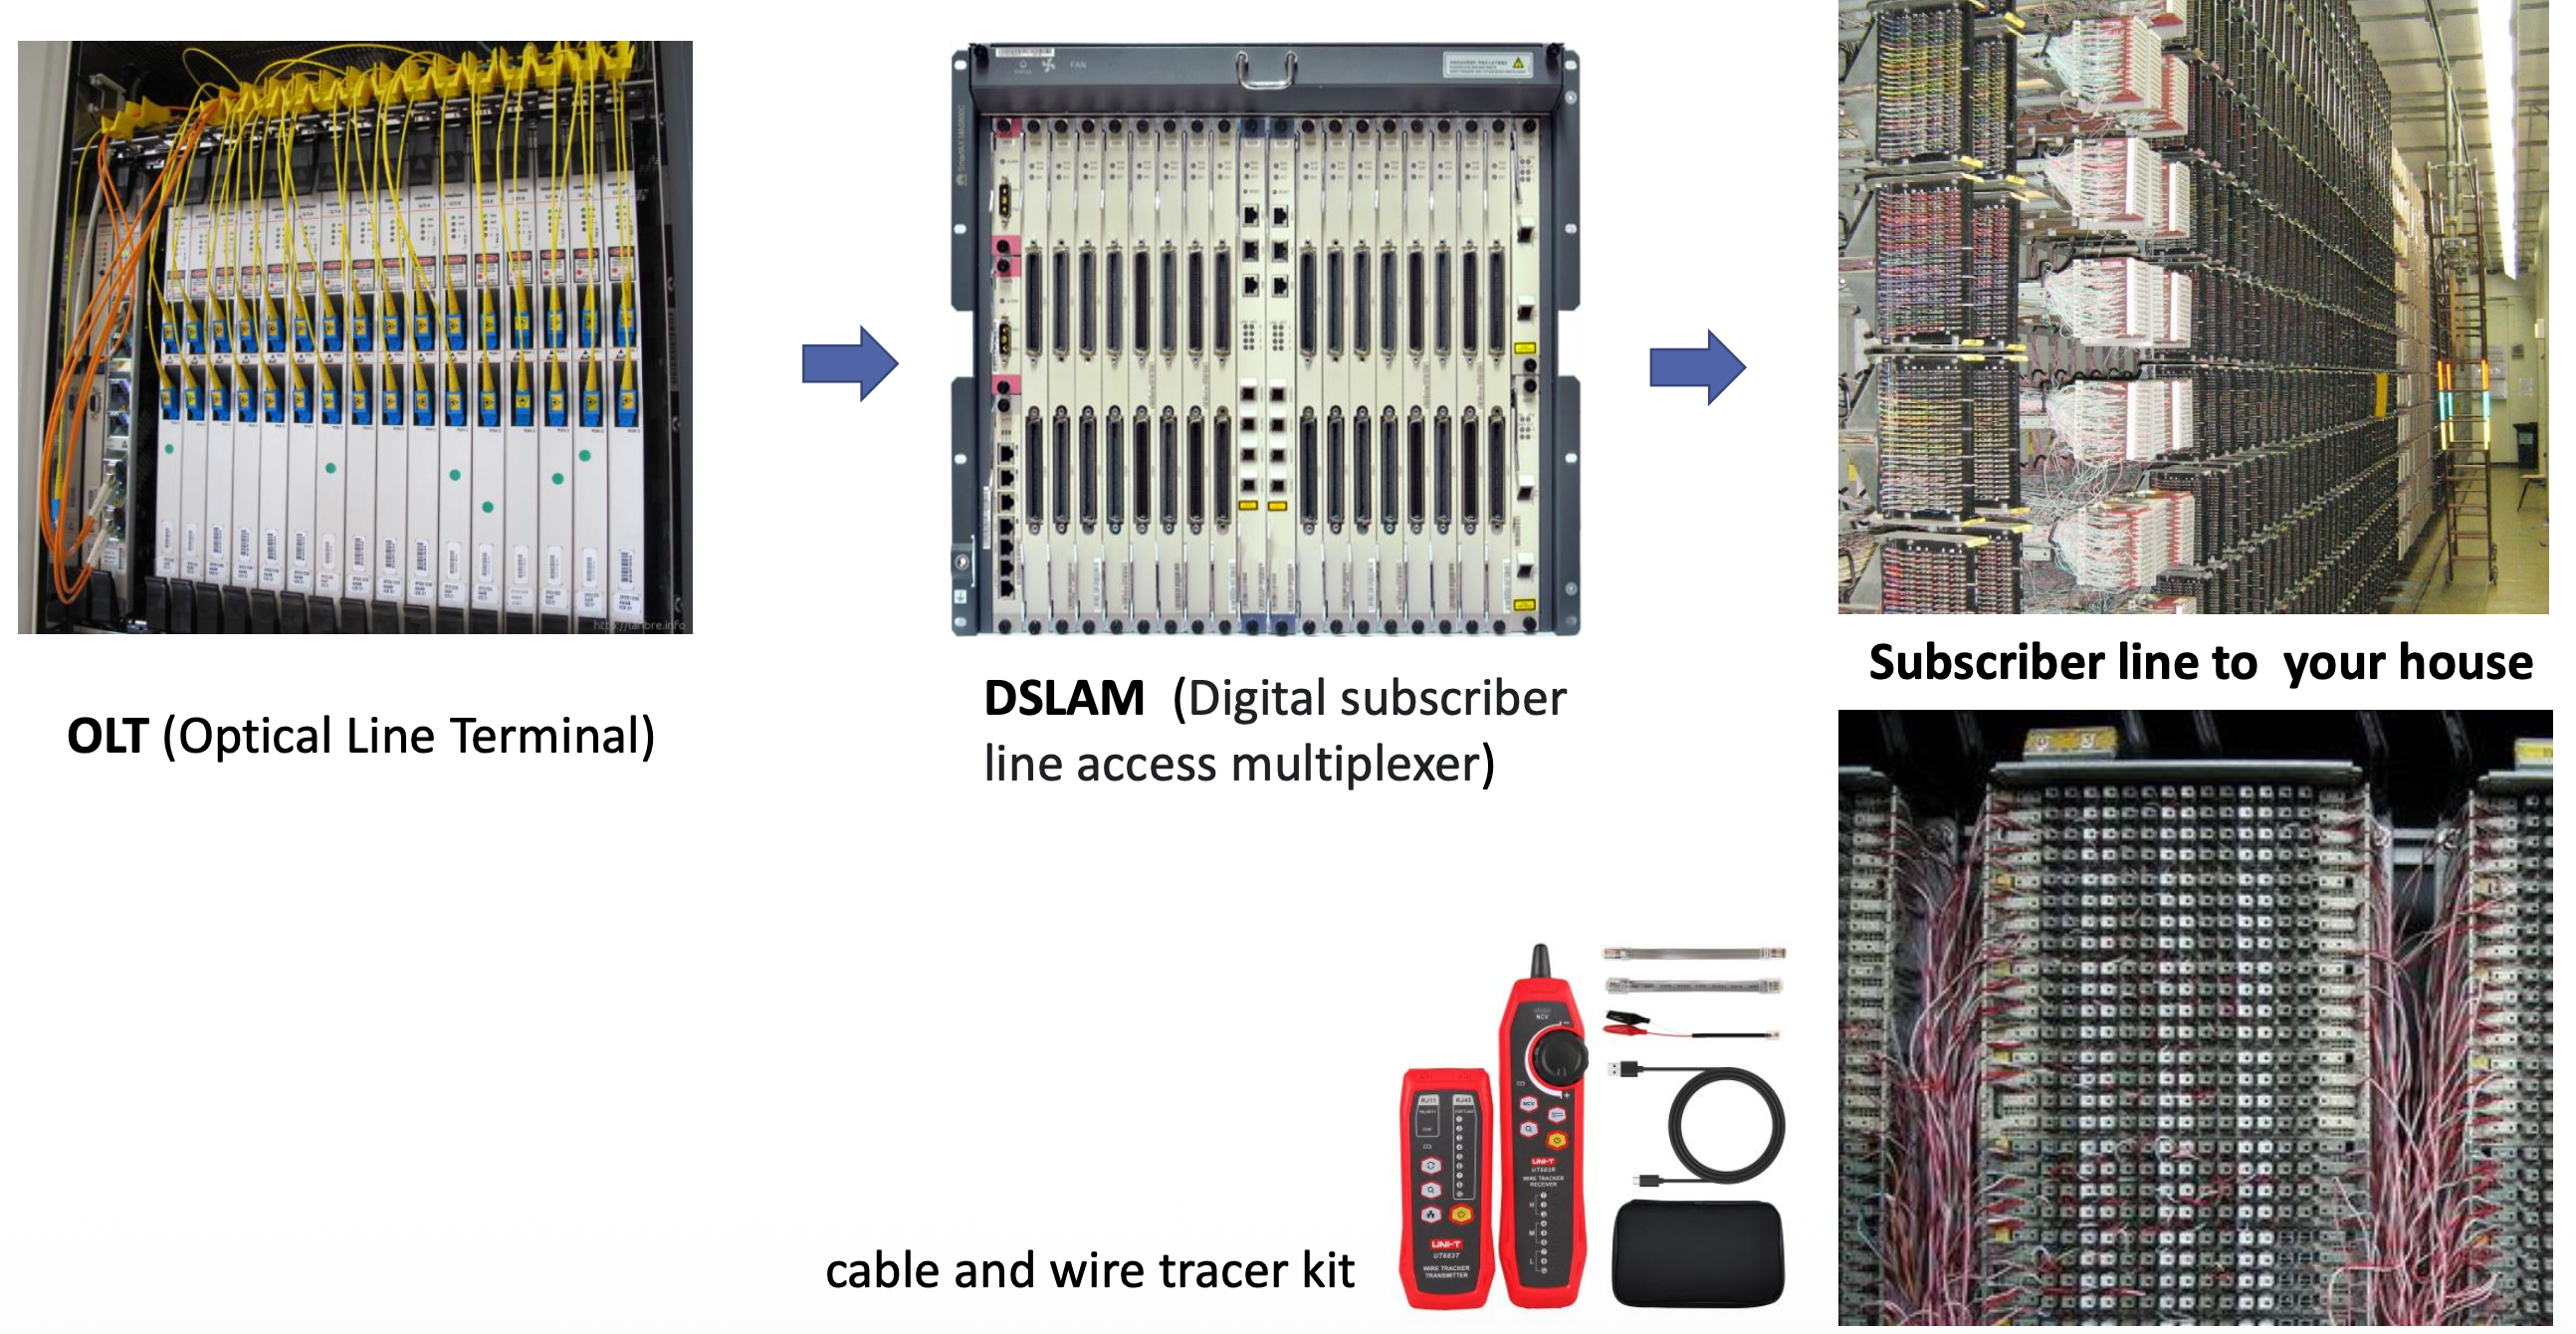
- OLT (Optical Line Terminal) - Located at the ISP's central office
- DSLAM (Digital Subscriber Line Access Multiplexer)
- Subscriber line to your house
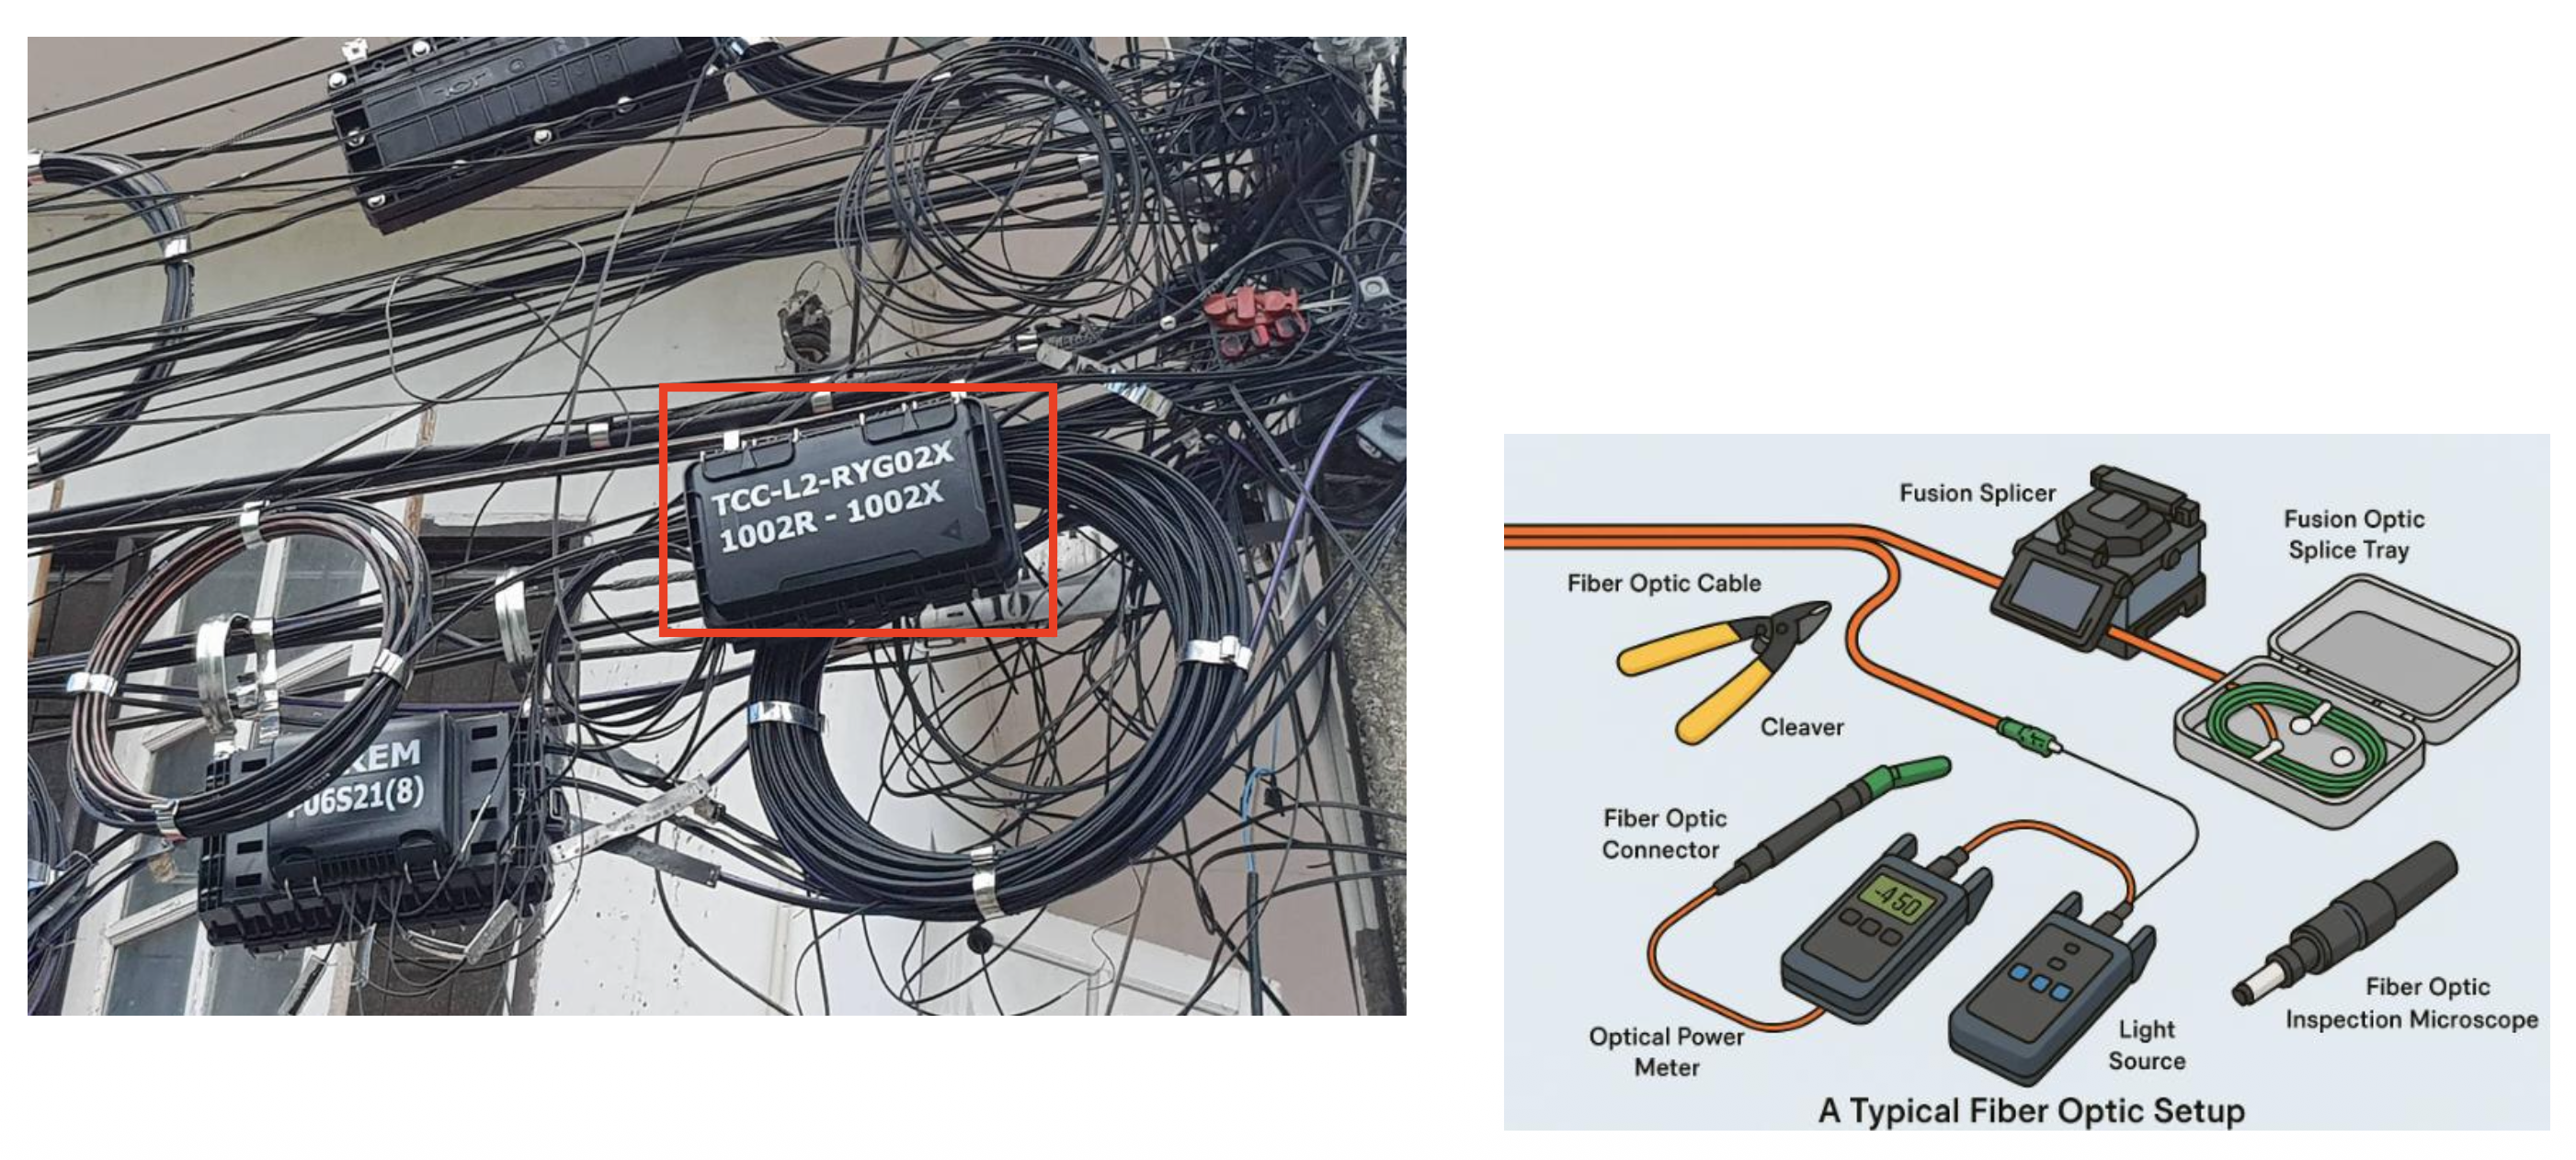
Analogy: Fiber is like having your own private jet runway compared to DSL/Cable which is like sharing a bus route. Much faster and more reliable!
Wireless/Mobile Access
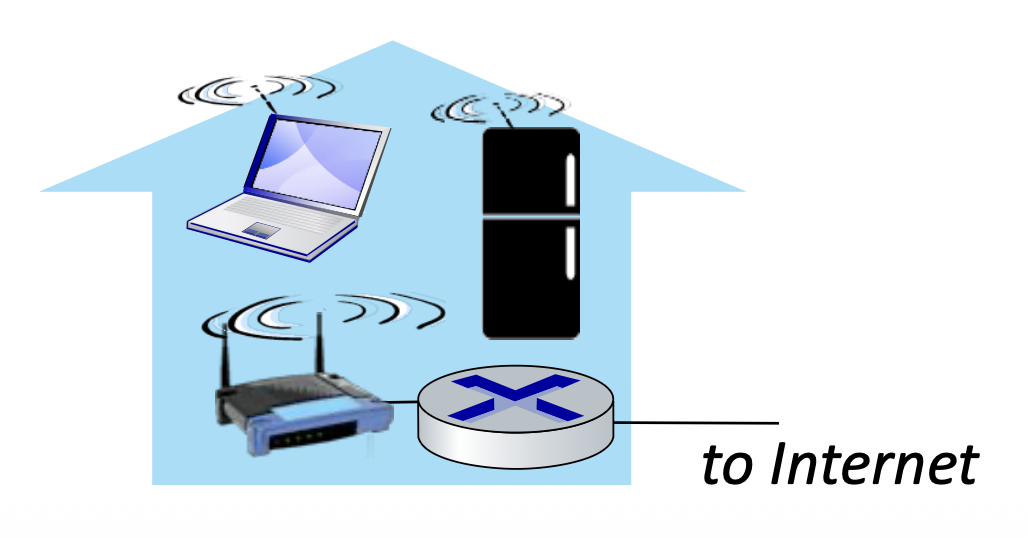
Shared Wireless Access Network
Connects end system to router via base station aka "access point"
Wireless Local Area Networks (WLANs)
- Typically within or around building (~100 ft)
- 802.11b/g/n (WiFi): 11, 54, 450 Mbps transmission rate
- 2.4GHz, 5GHz, 6GHz (Frequency)
Image: Home wireless network connecting to Internet
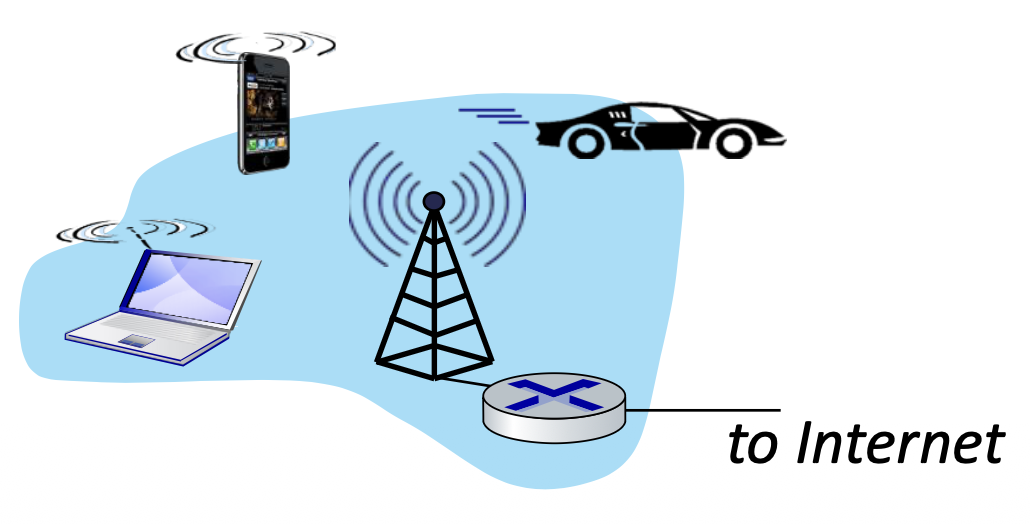
Wide-area Cellular Access Networks
- Provided by mobile, cellular network operator (10's km)
- 3G (GSM), 4G (LTE), 5G (mmWave) (Generation)
- 10's Mbps
- 4G cellular networks (5G coming)
Image: Mobile cellular tower connecting to Internet
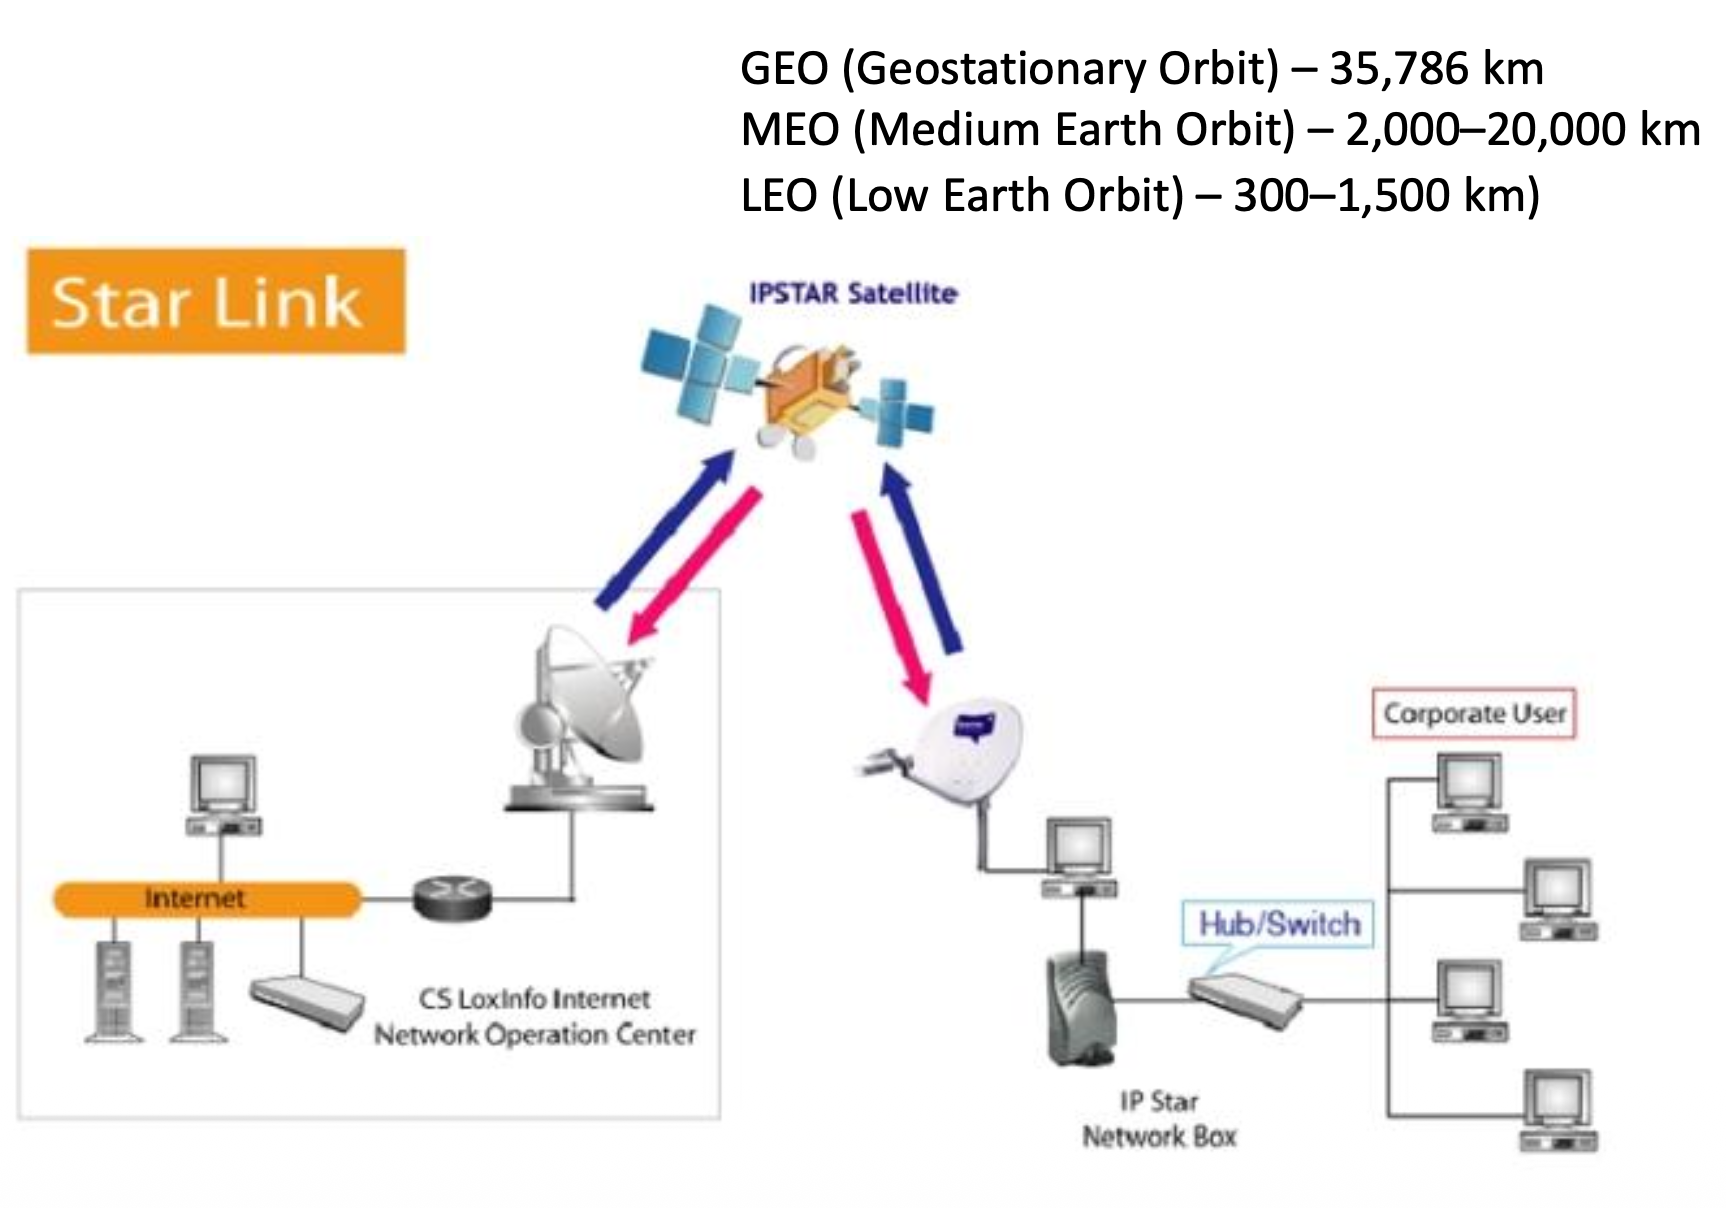
Satellite Internet
มองให้เป็น last resource option ได้เลย ต้องสุดจริง ๆ ถือจะได้ใช้
Use Cases
- Remote villages
- Islands and rural communities
- Maritime (ships, offshore platforms)
- Aviation (in-flight Wi-Fi)
- Disaster recovery (floods, earthquakes)
- Military/emergency operations
Image: Satellite internet network diagram showing StarLink, IPSTAR Satellite, and IP Star Network Box
Satellite Orbit Types
| Orbit Type | Altitude | Latency | Speed Performance | Number of Satellites Needed | Typical Uses | Examples |
|---|---|---|---|---|---|---|
| GEO (Geostationary Orbit) | ~35,786 km | High (500–700 ms) | Moderate | Few (3 can cover most of Earth) | TV broadcast, basic satellite Internet | Thaicom |
| MEO (Medium Earth Orbit) | 2,000–20,000 km | Medium (~100–150 ms) | High | Medium number | Maritime, aviation, enterprise | SES O3b |
| LEO (Low Earth Orbit) | 300–1,500 km | Low (20–40 ms) | Very high | Thousands | High-speed Internet, remote connectivity | Starlink, OneWeb, Amazon Kuiper |
Analogy:
- GEO is like a drone hovering very high - it can see a lot but takes time to communicate
- LEO is like many low-flying drones - faster communication but need more of them to cover the same area
Home Networks
Typical Home Network Setup
Image: Home network topology diagram
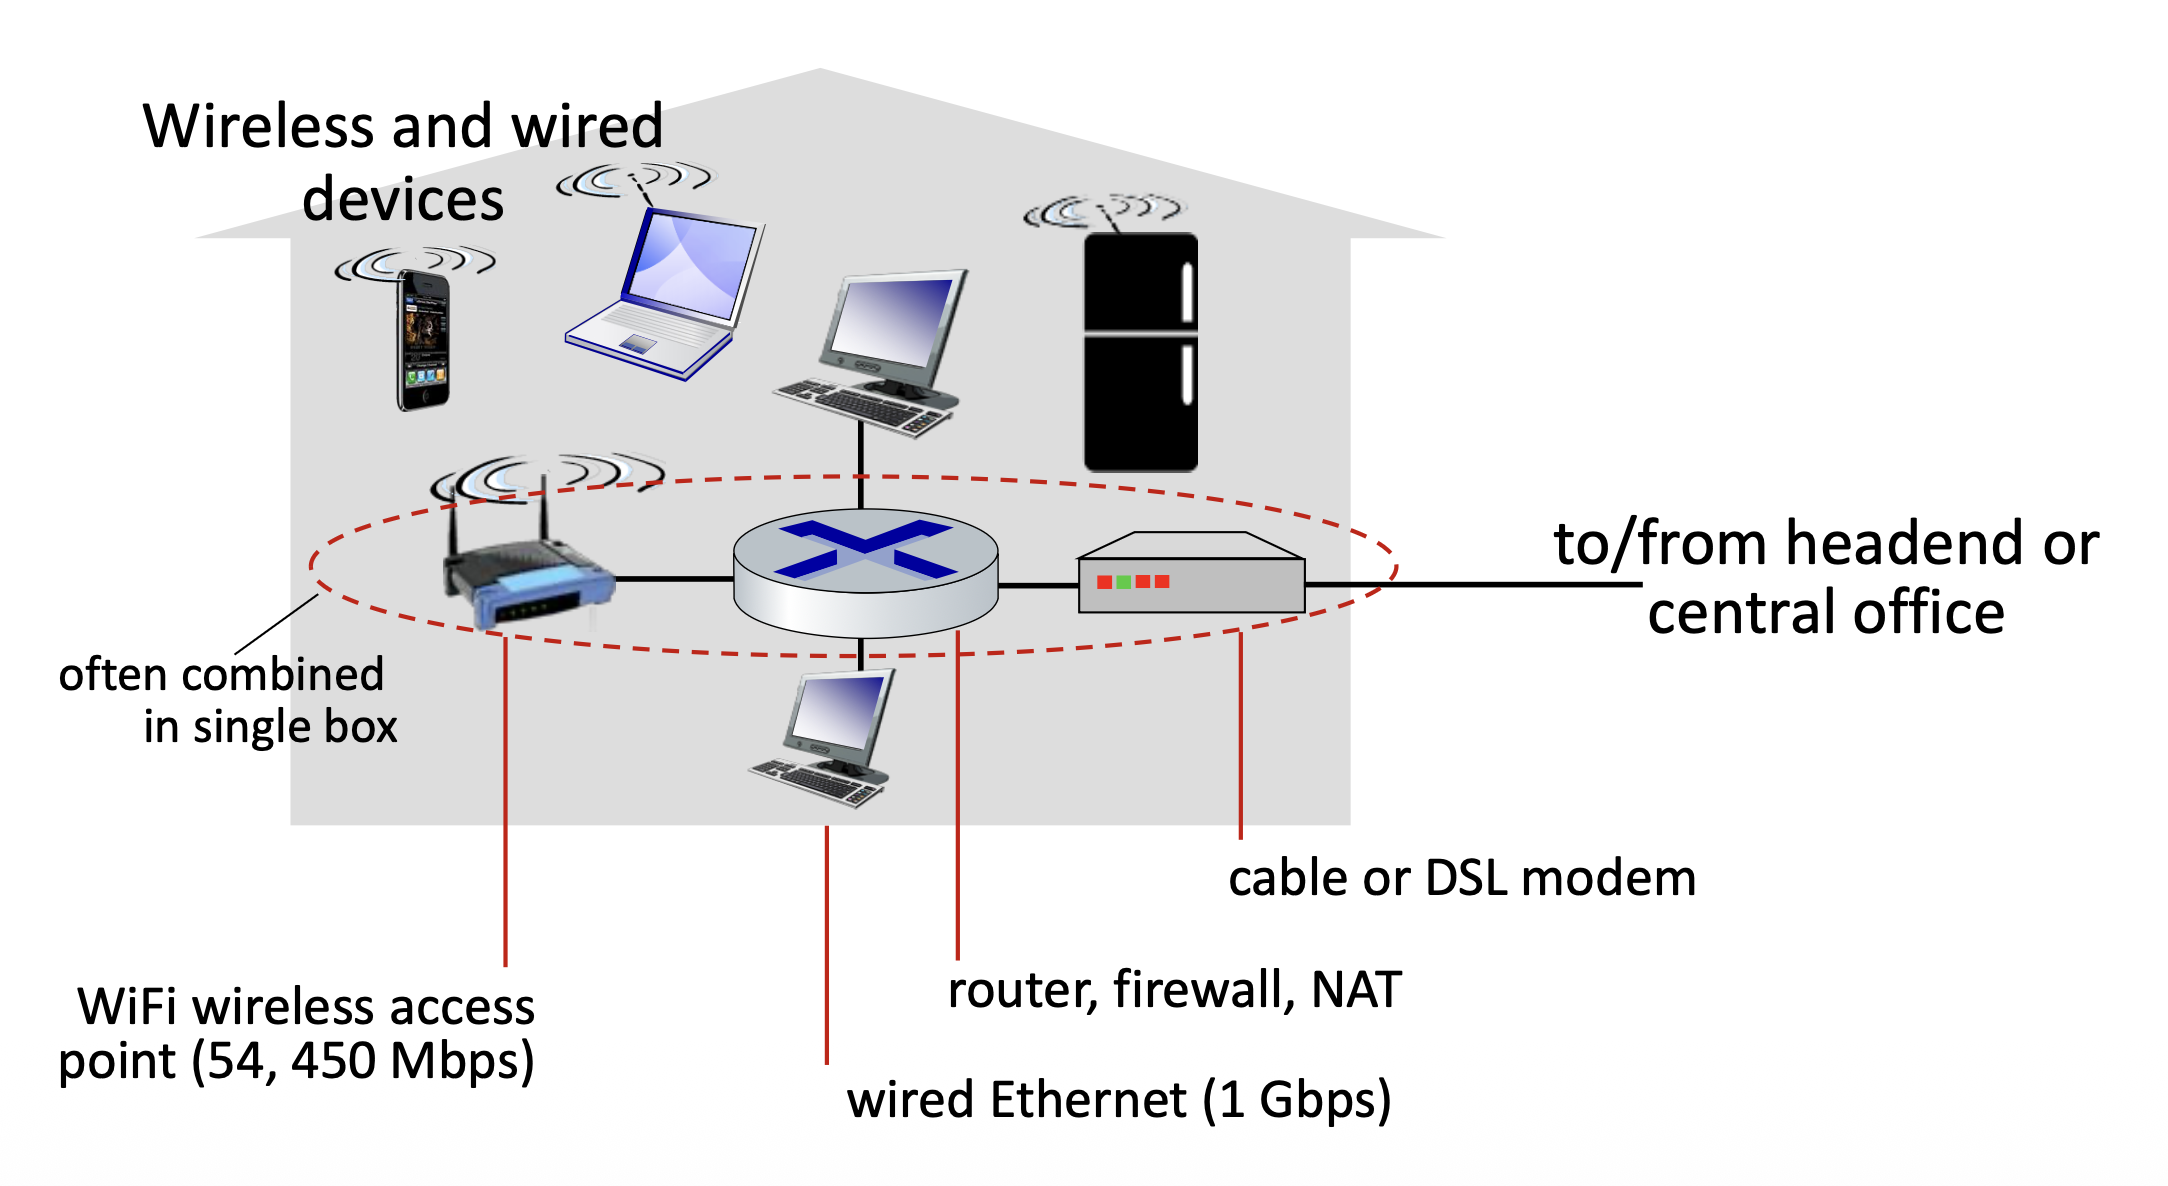
Components:
- Cable or DSL modem
- Router, firewall, NAT (often combined in single box)
- Wired Ethernet (1 Gbps)
- WiFi wireless access point (54, 450 Mbps)
- Wireless and wired devices
Connection: to/from headend or central office
Wi-Fi Router Types
Image: Three types of routers
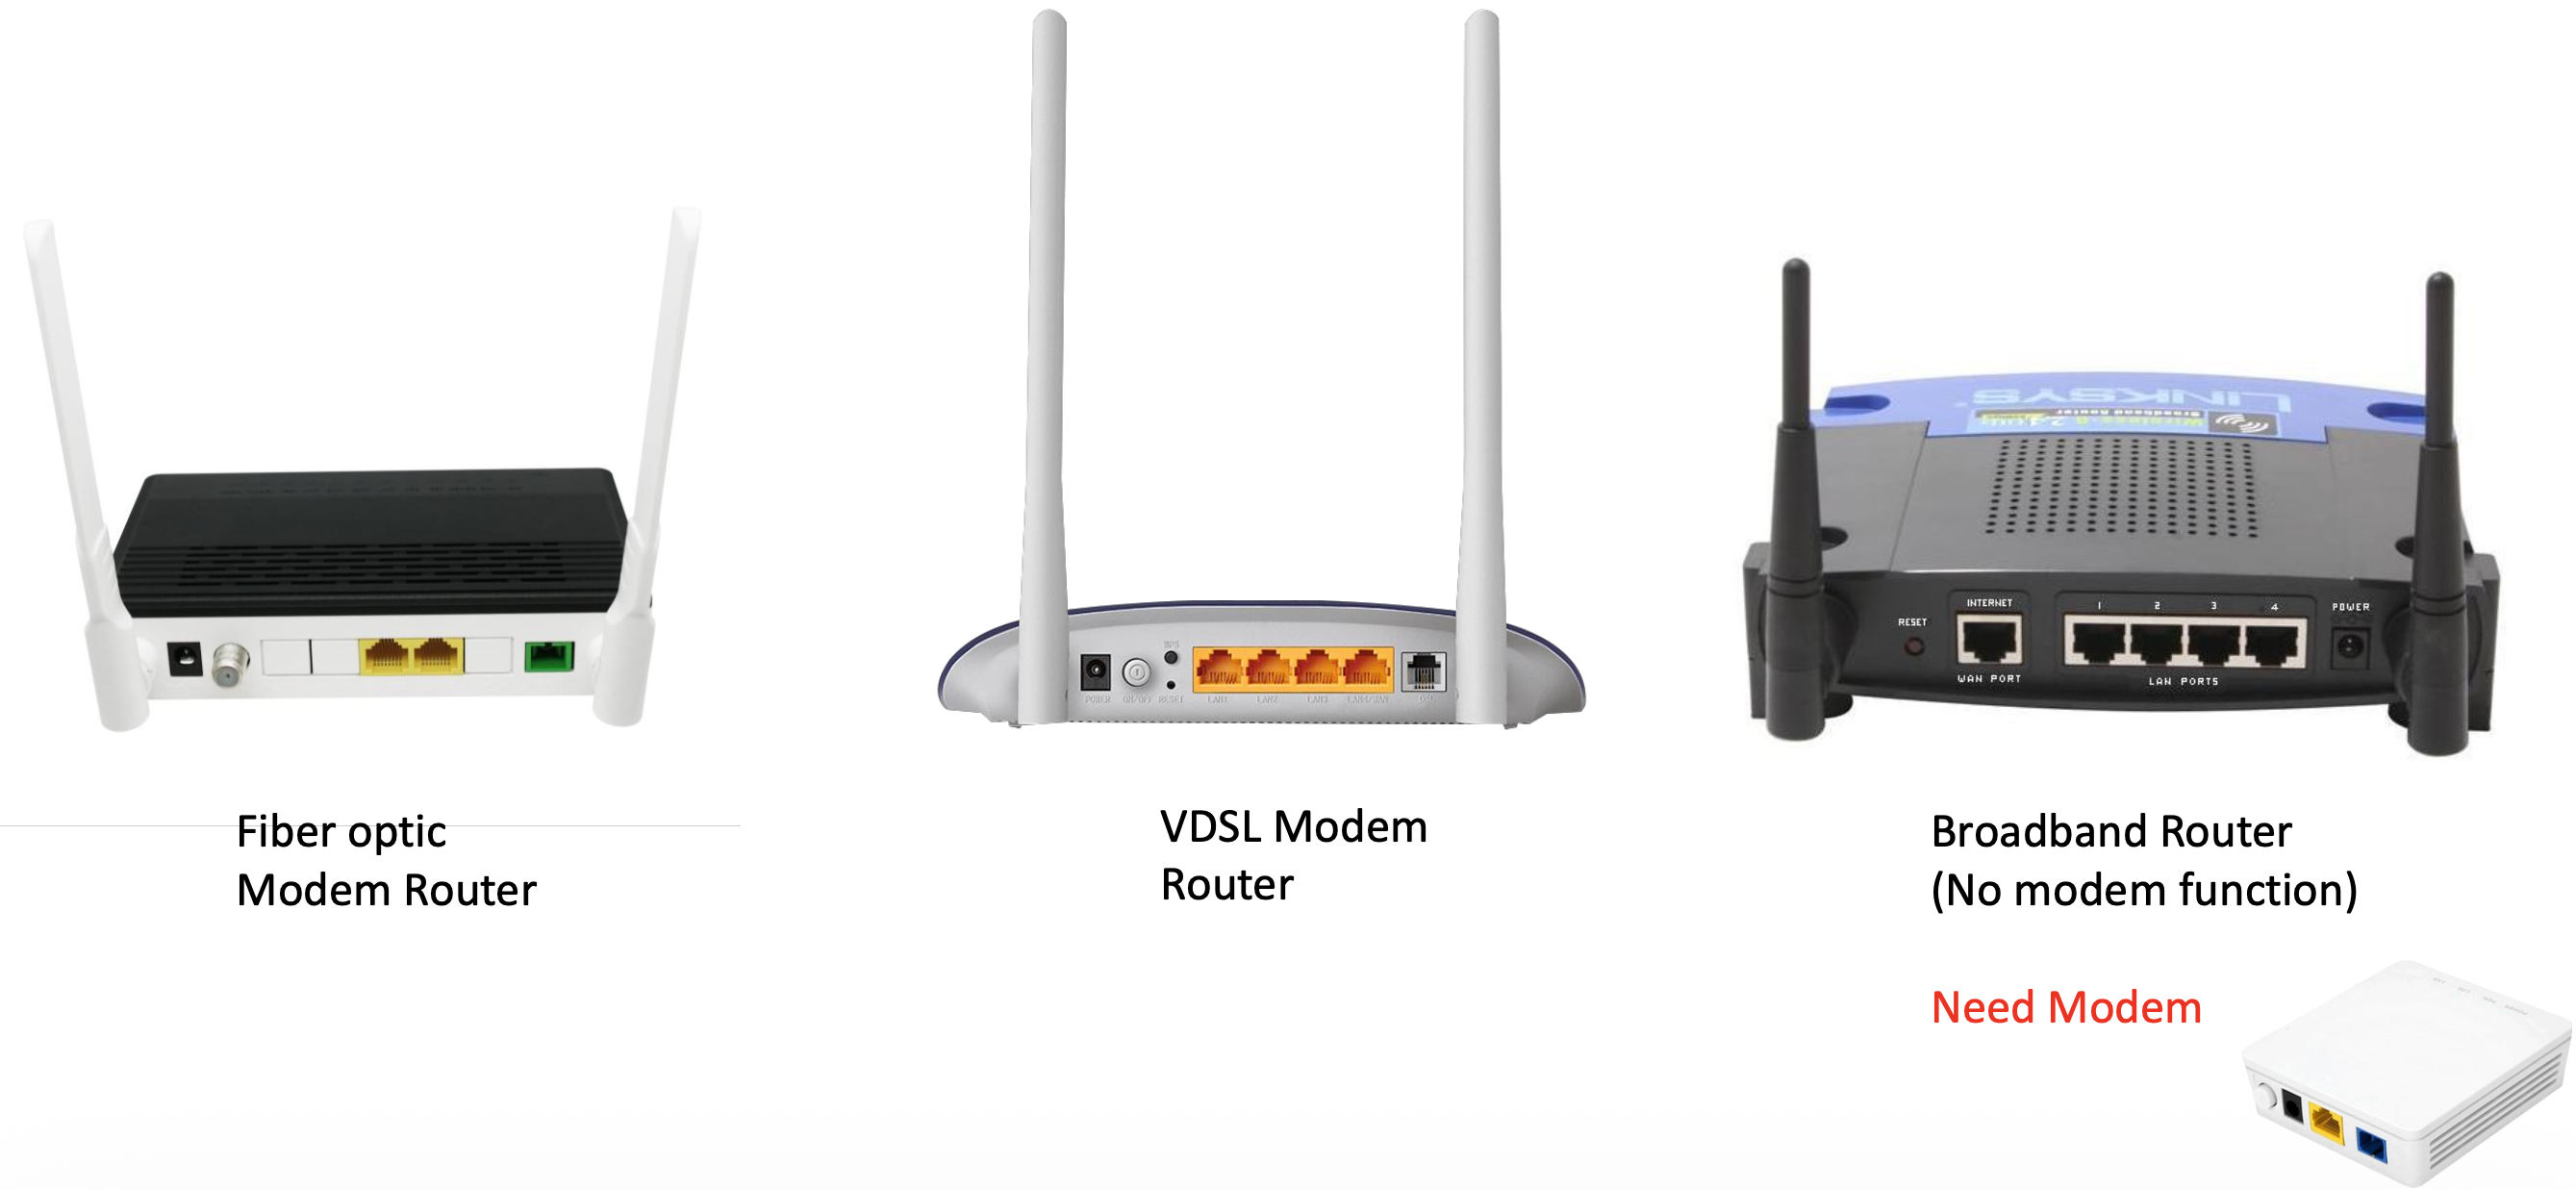
- Fiber optic Modem Router
- Has green WAN port for fiber connection
- VDSL Modem Router
- Has RJ11 port for telephone line
- Broadband Router (No modem function)
- Need separate Modem
- Only has Ethernet ports
Enterprise Networks
Image: Enterprise network diagram showing Ethernet switch, institutional mail/web servers, institutional router, and Enterprise link to ISP
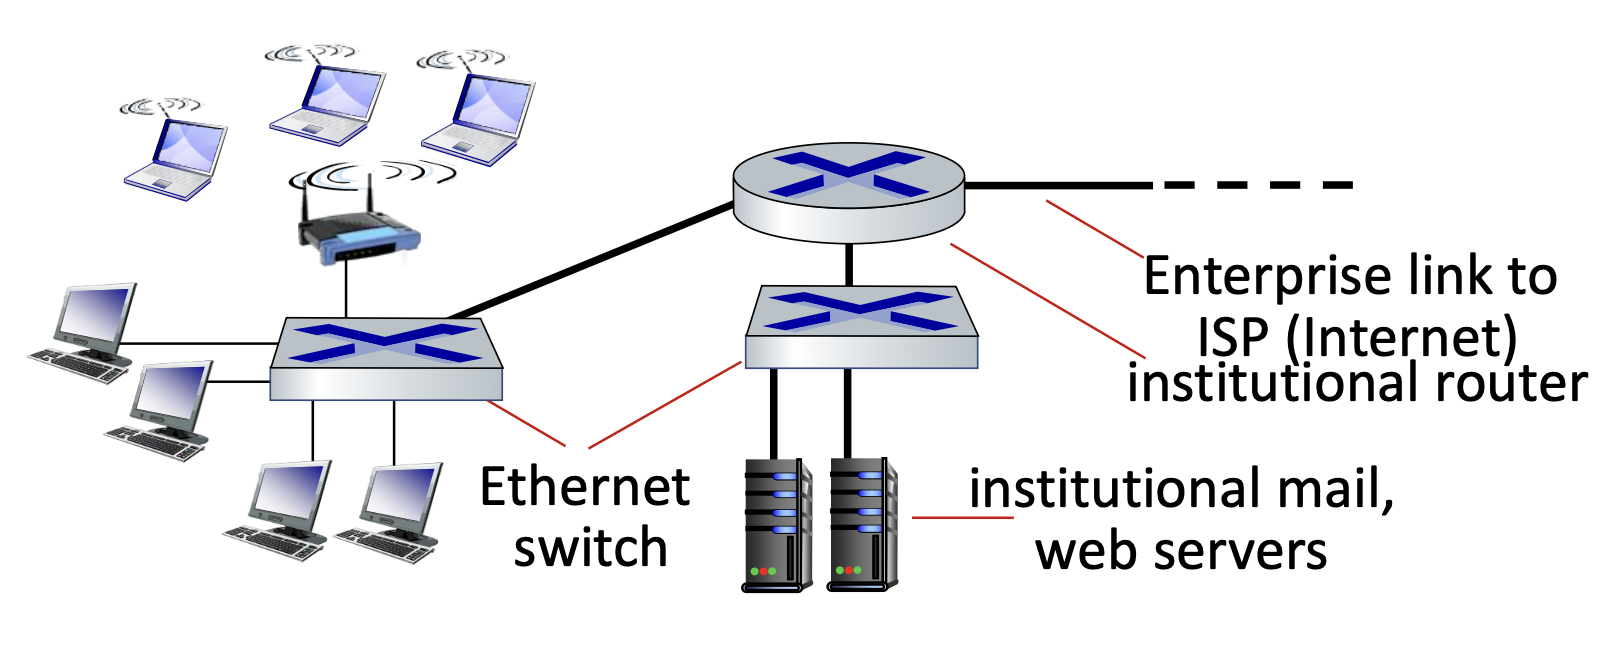
Components
- Companies, Universities, etc.
- Mix of wired, wireless link technologies
- Connecting a mix of switches and routers
Technologies:
- Ethernet: wired access at 100Mbps, 1Gbps, 10Gbps
- WiFi: wireless access points at 11, 54, 450 Mbps
Data Center Networks
Characteristics
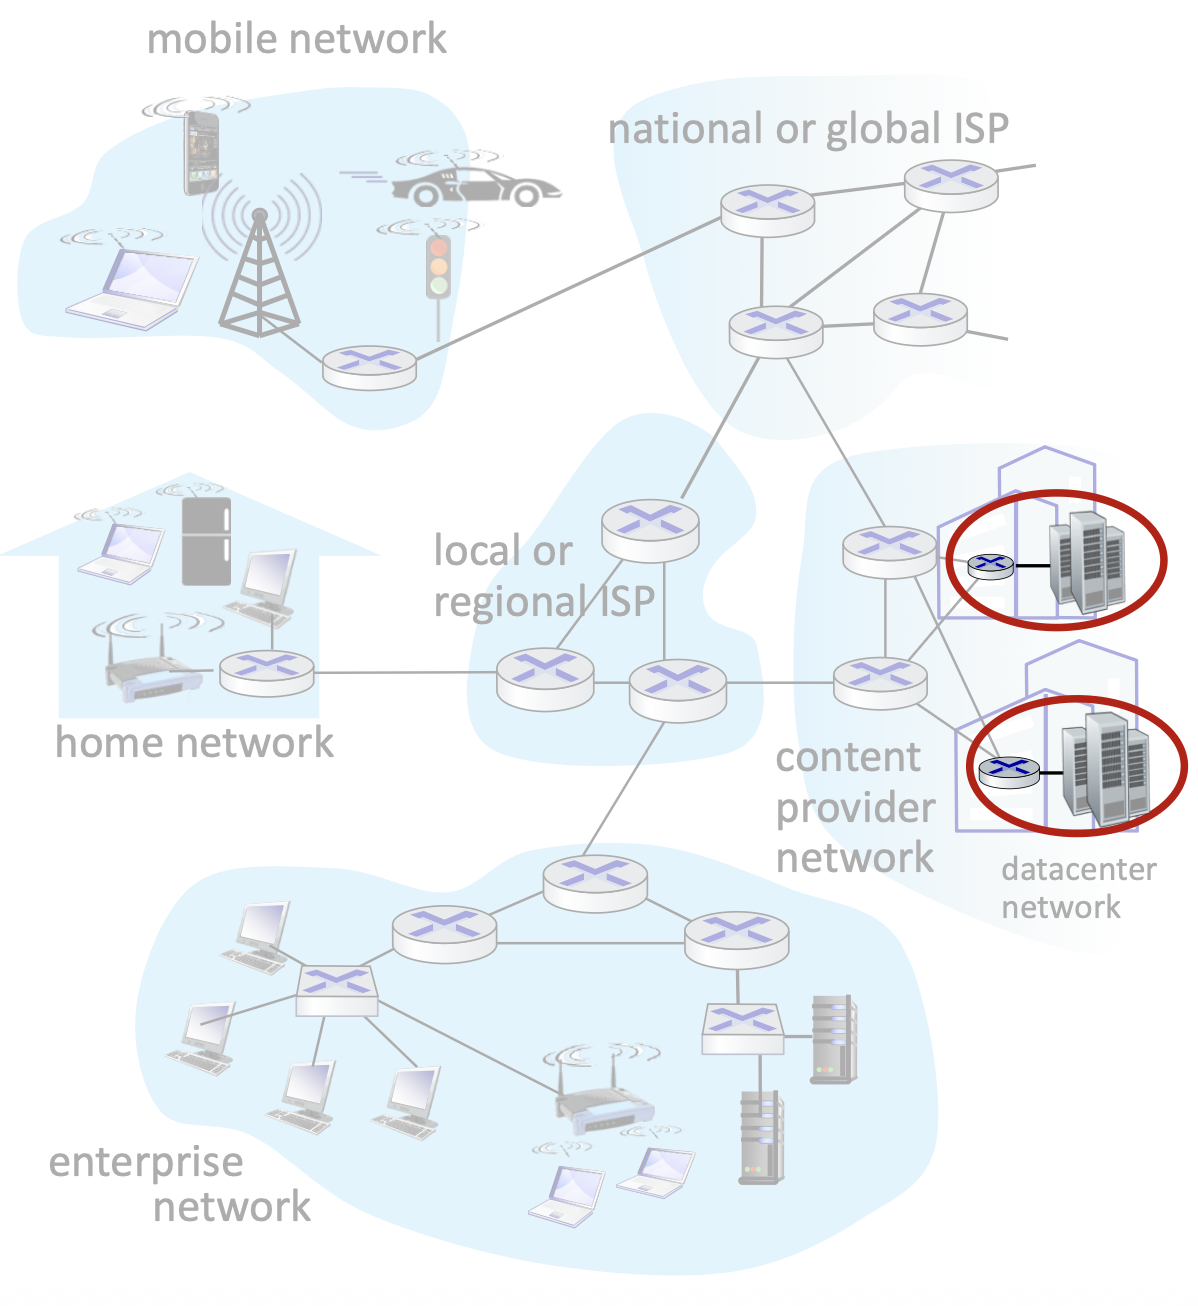
- High-bandwidth links (10s to 100s Gbps) connect hundreds to thousands of servers together, and to Internet
Image: Data center corridor and server rack photos
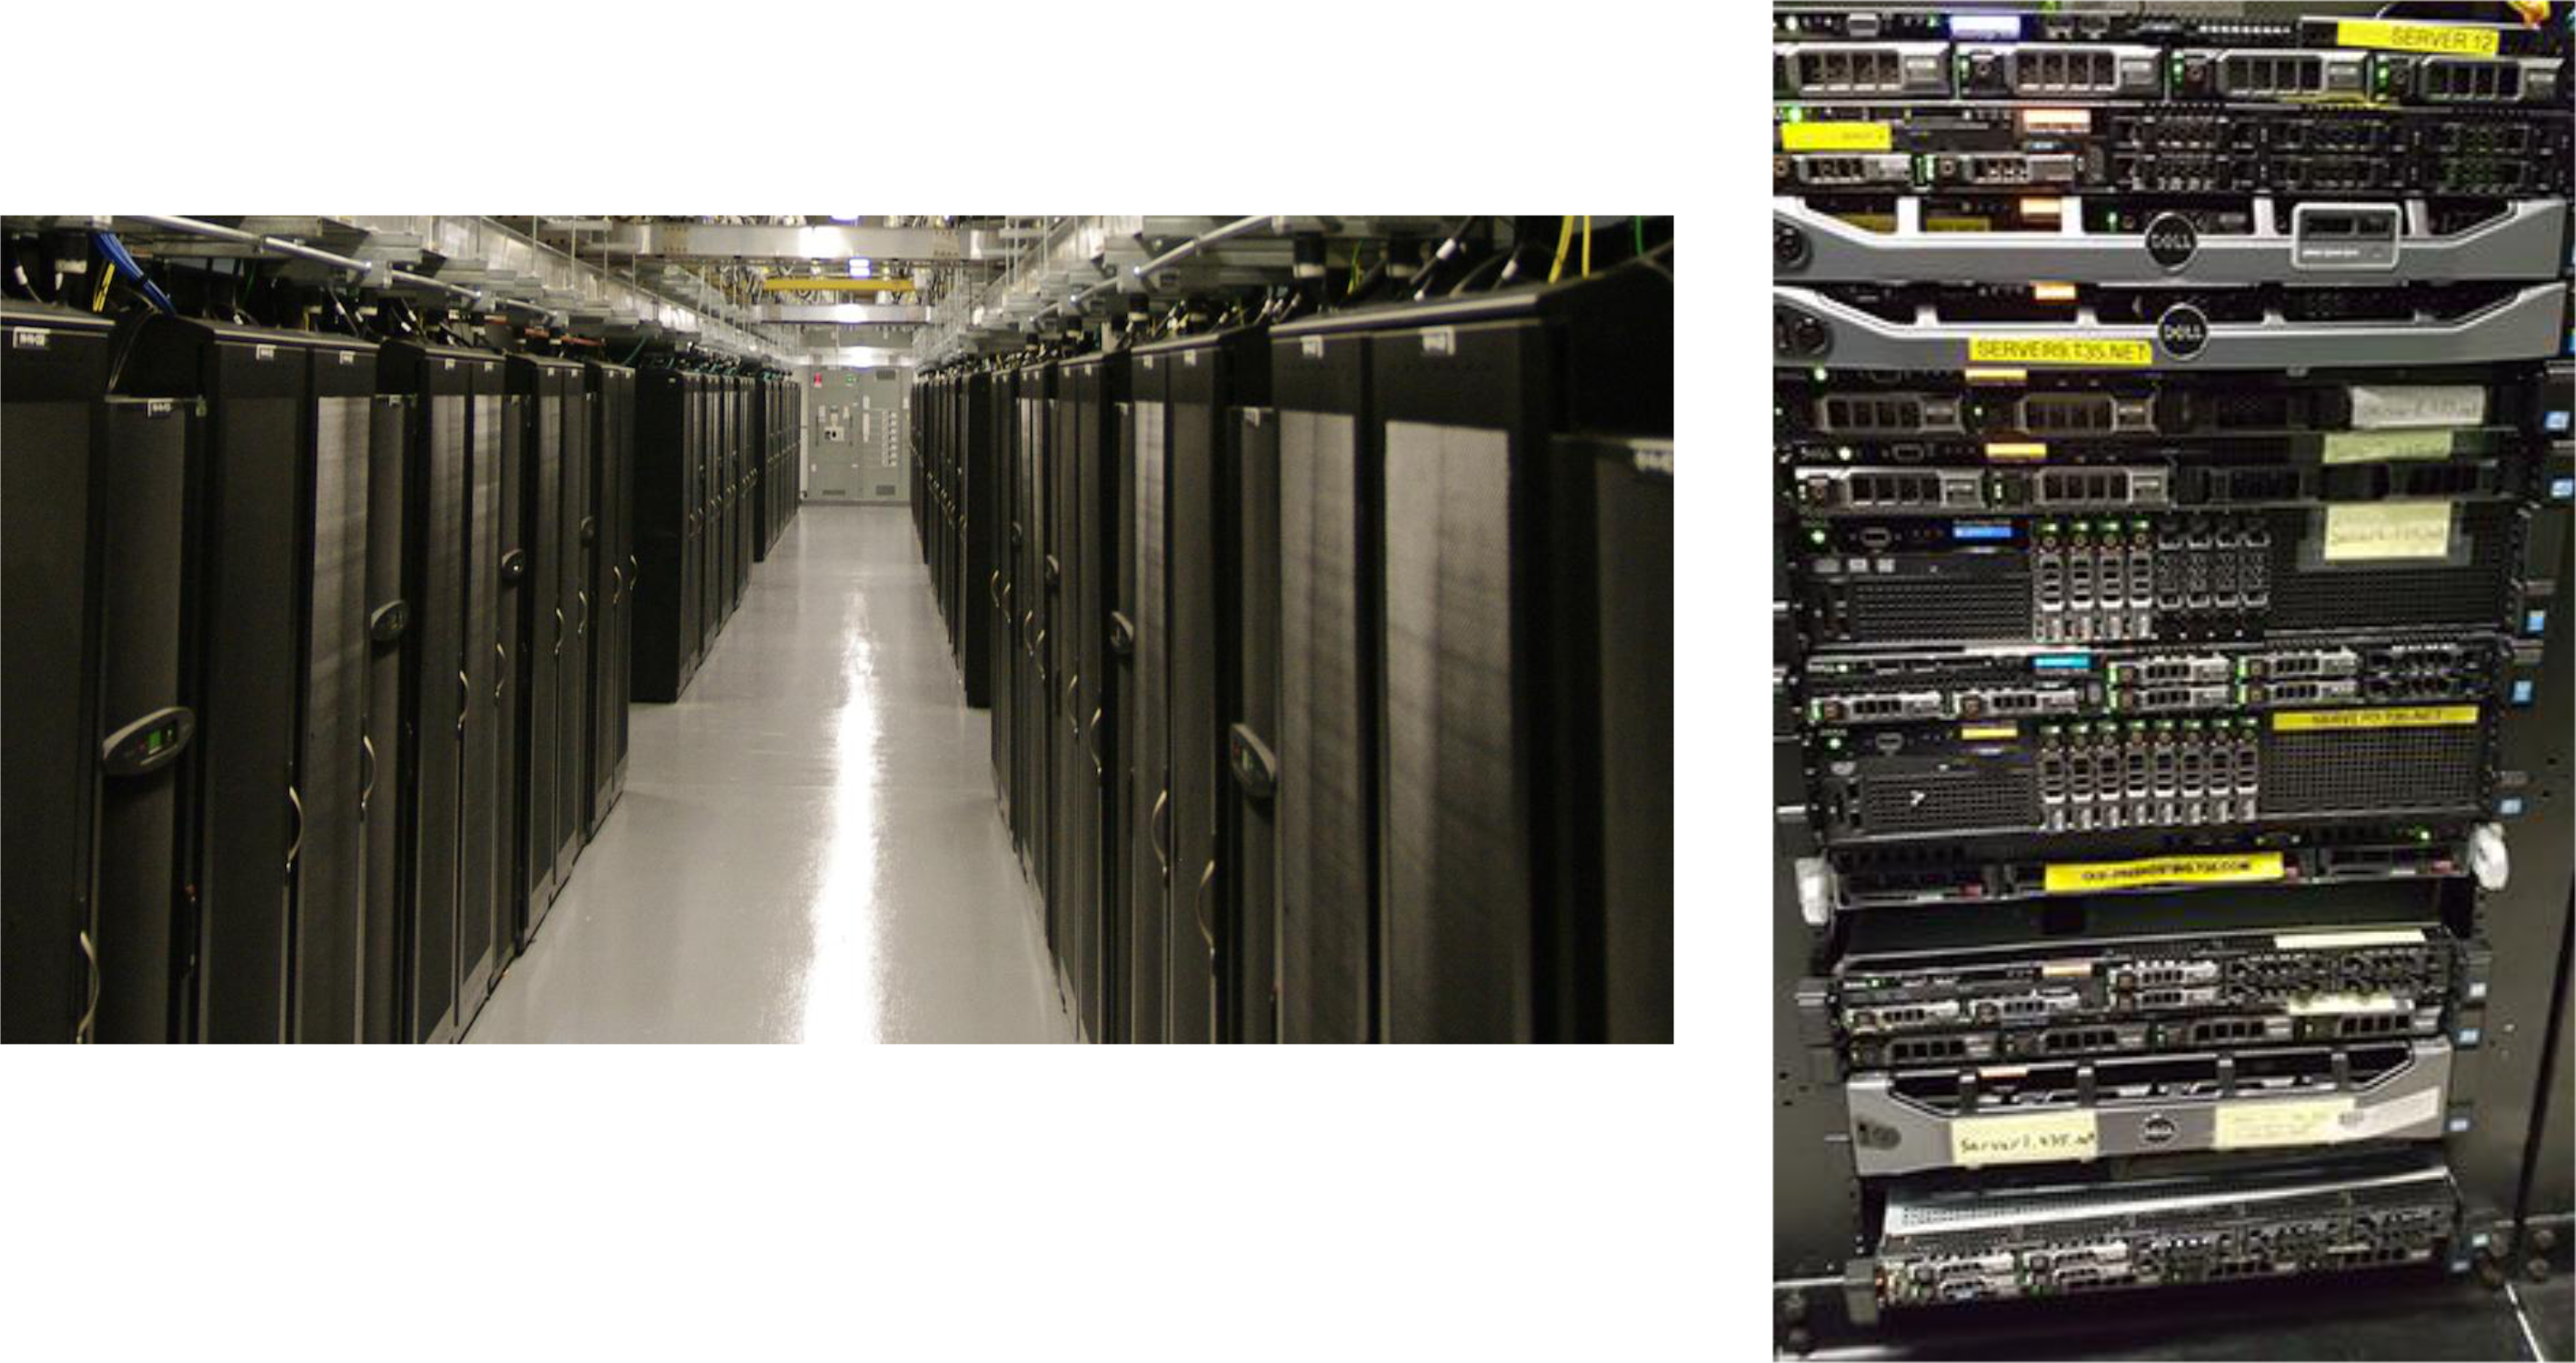
Image: Internet topology showing datacenter networks highlighted
Internet Service Provider (ISP)
Definition
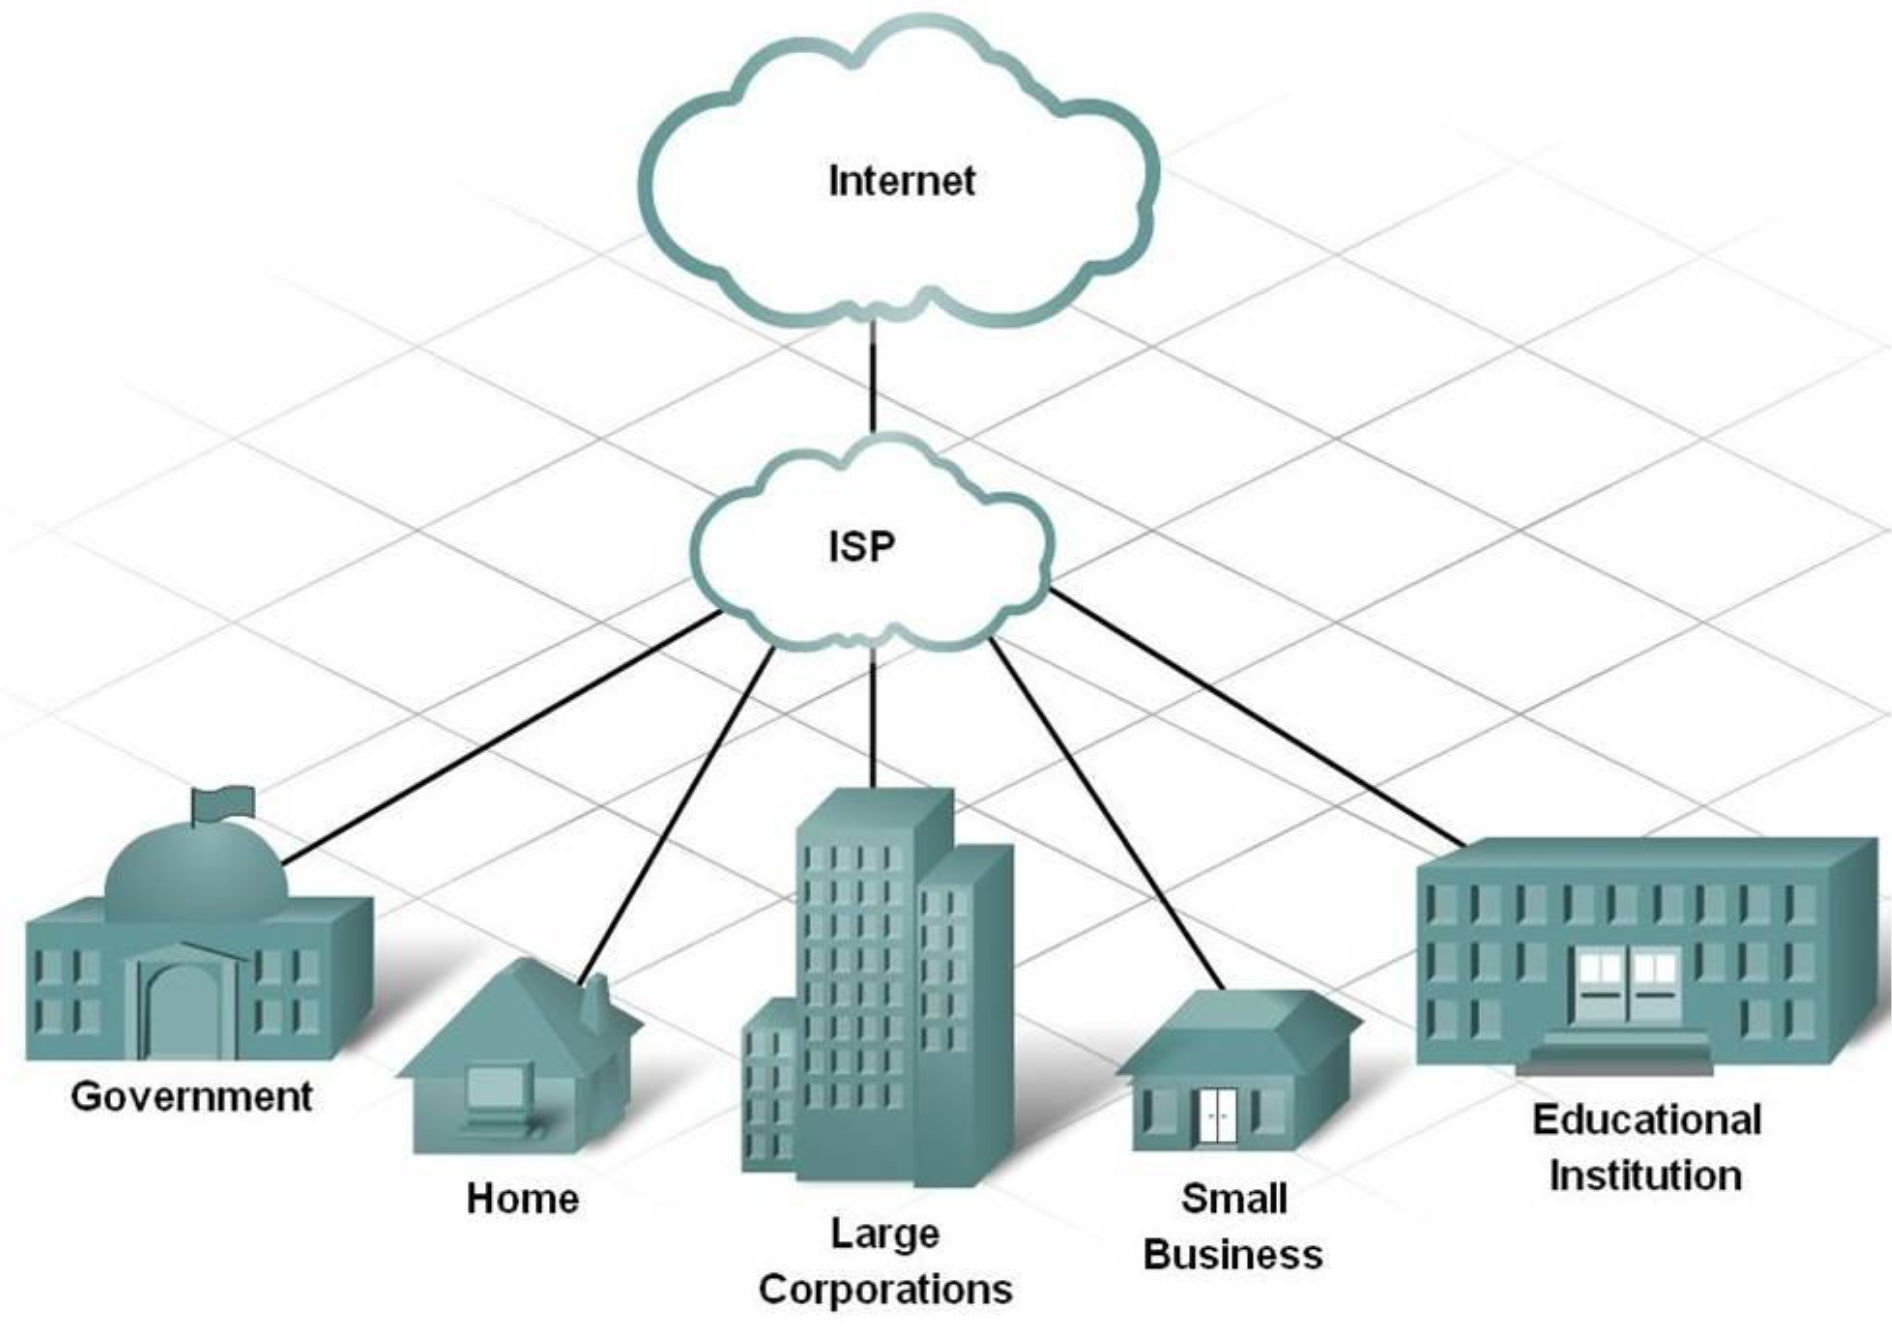
- An ISP is a company that provides the connection and support to access the Internet
- Any home, business or organization that wants to connect to the Internet must use an ISP
ISP Categories
ISP range in size and differ in term of the area they service:
- Limited service to small geographical area or variety of services
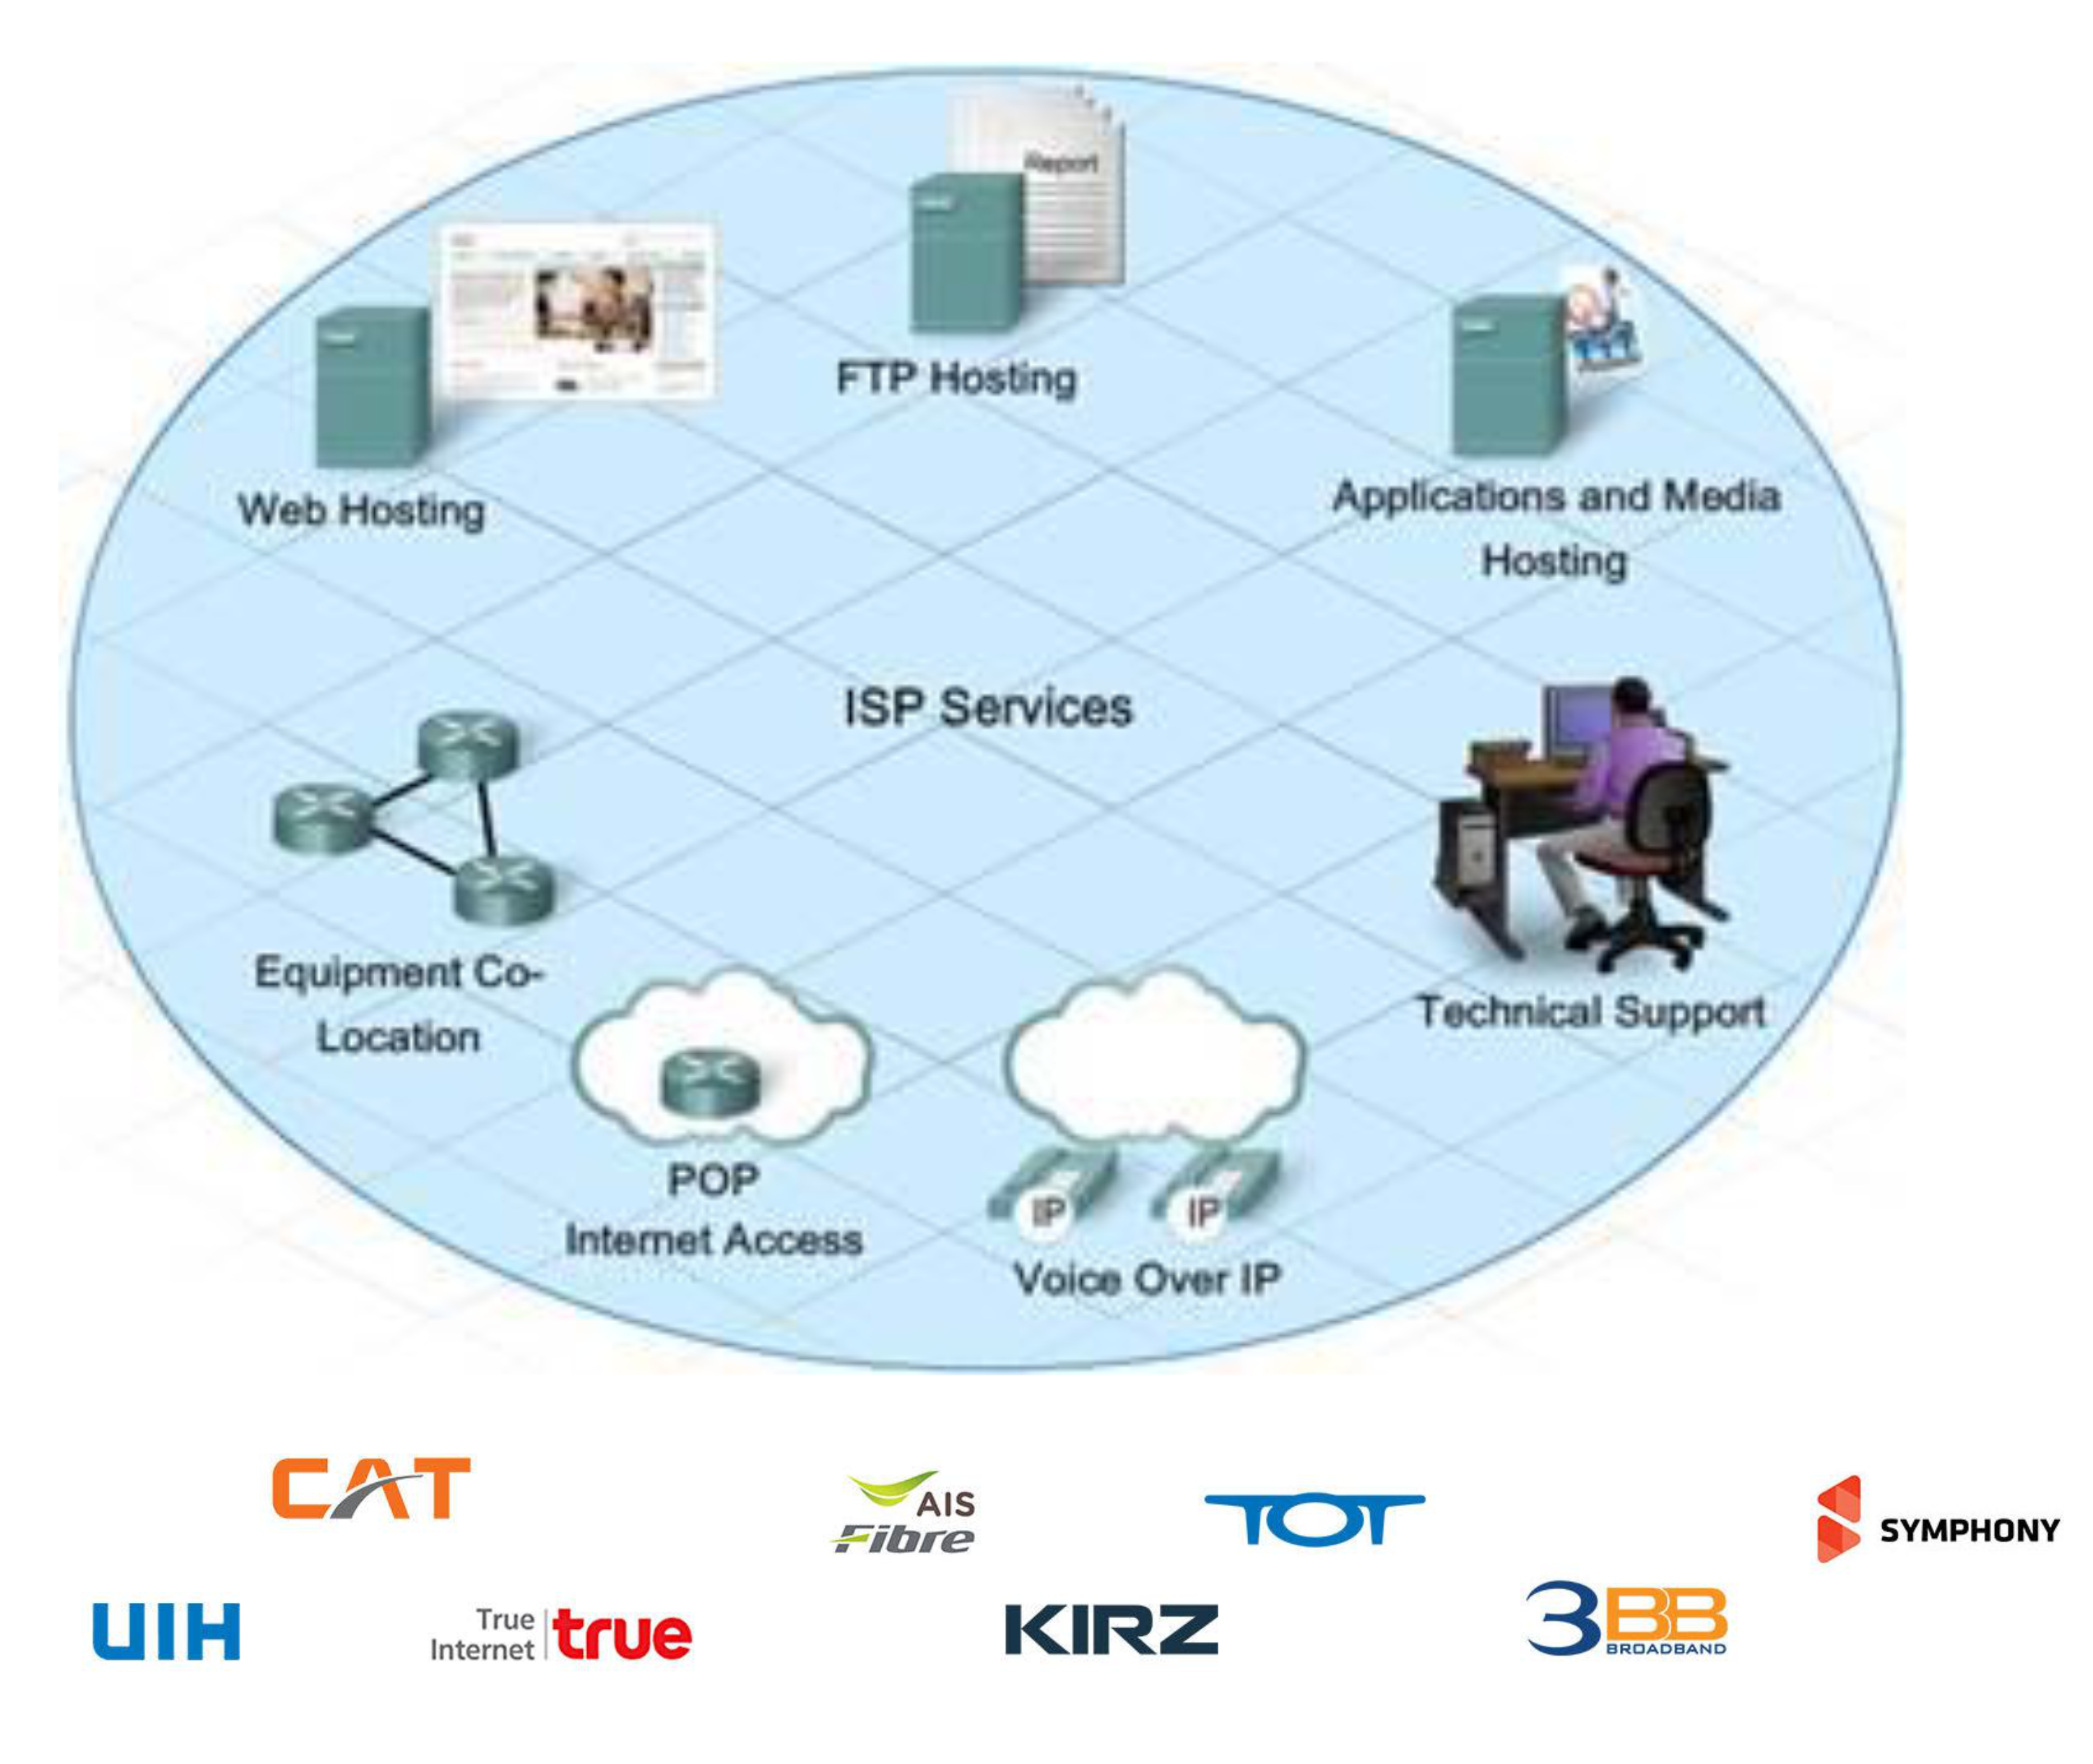
ISP Services
Variety of Services:
- Internet
- Hosting
- Co-Location
- Cloud Service
- Access Network
- Etc.
Thai ISP Examples:
- CAT, UIH, True, AIS Fibre, TOT, KIRZ, 3BB, Symphony
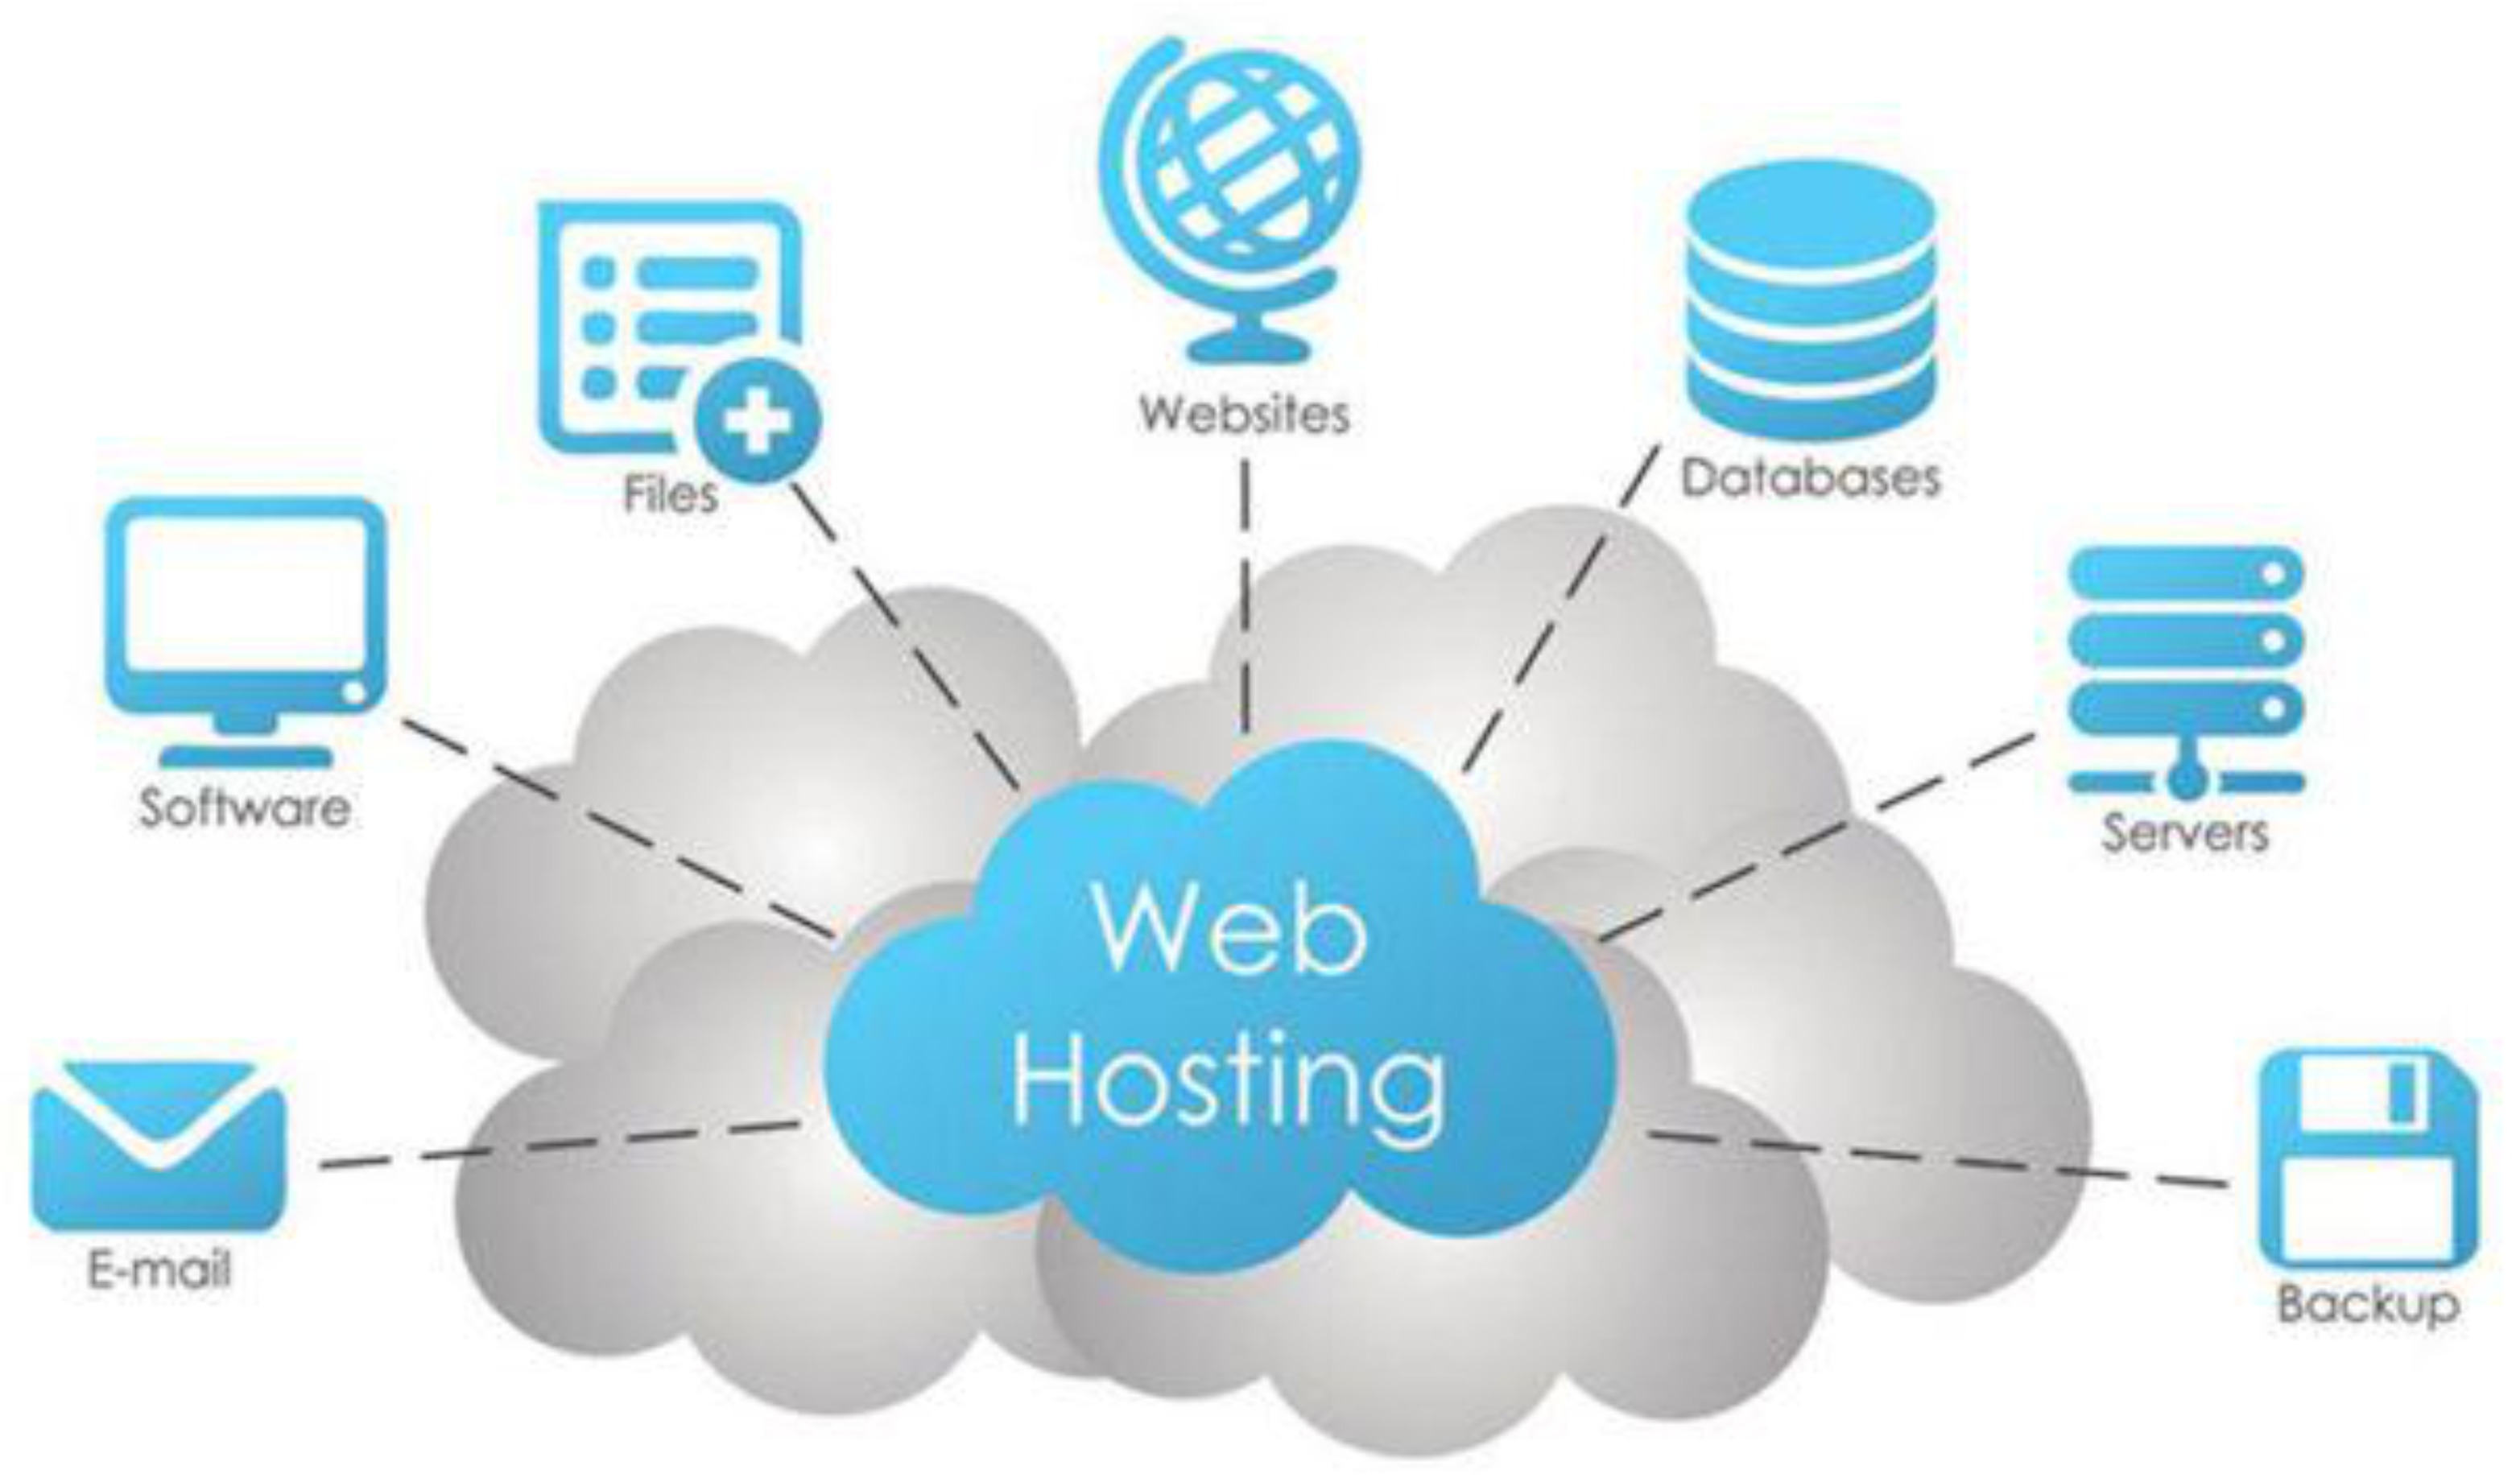
Web Hosting Service
Image: Web Hosting cloud diagram showing Files, Websites, Databases, Software, Servers, E-mail, Backup
Web Hosting Packages
Image: GoDaddy hosting price tiers
Example Tiers:
-
Economy - $5.99/mo
- 1 website
- 25 GB storage
- 10 databases
- Unmetered bandwidth
-
Deluxe - $7.99/mo
- 10 websites
- 50 GB storage
- 25 databases
- Unmetered bandwidth
-
Ultimate - $12.99/mo
- 25 websites
- 75 GB storage
- 50 databases
- Unmetered bandwidth
-
Maximum - $19.99/mo
- 50 websites
- 100 GB storage
- 100 databases
- Unmetered bandwidth
Internet Structure
Network of Networks
- Hosts connect to Internet via access Internet Service Providers (ISPs)
- Access ISPs in turn must be interconnected
- So that any two hosts (anywhere!) can send packets to each other
- Resulting network of networks is very complex
- Evolution driven by economics, national policies
Evolution of Internet Structure
Question: Given millions of access ISPs, how to connect them together?
Image: Multiple access networks scattered
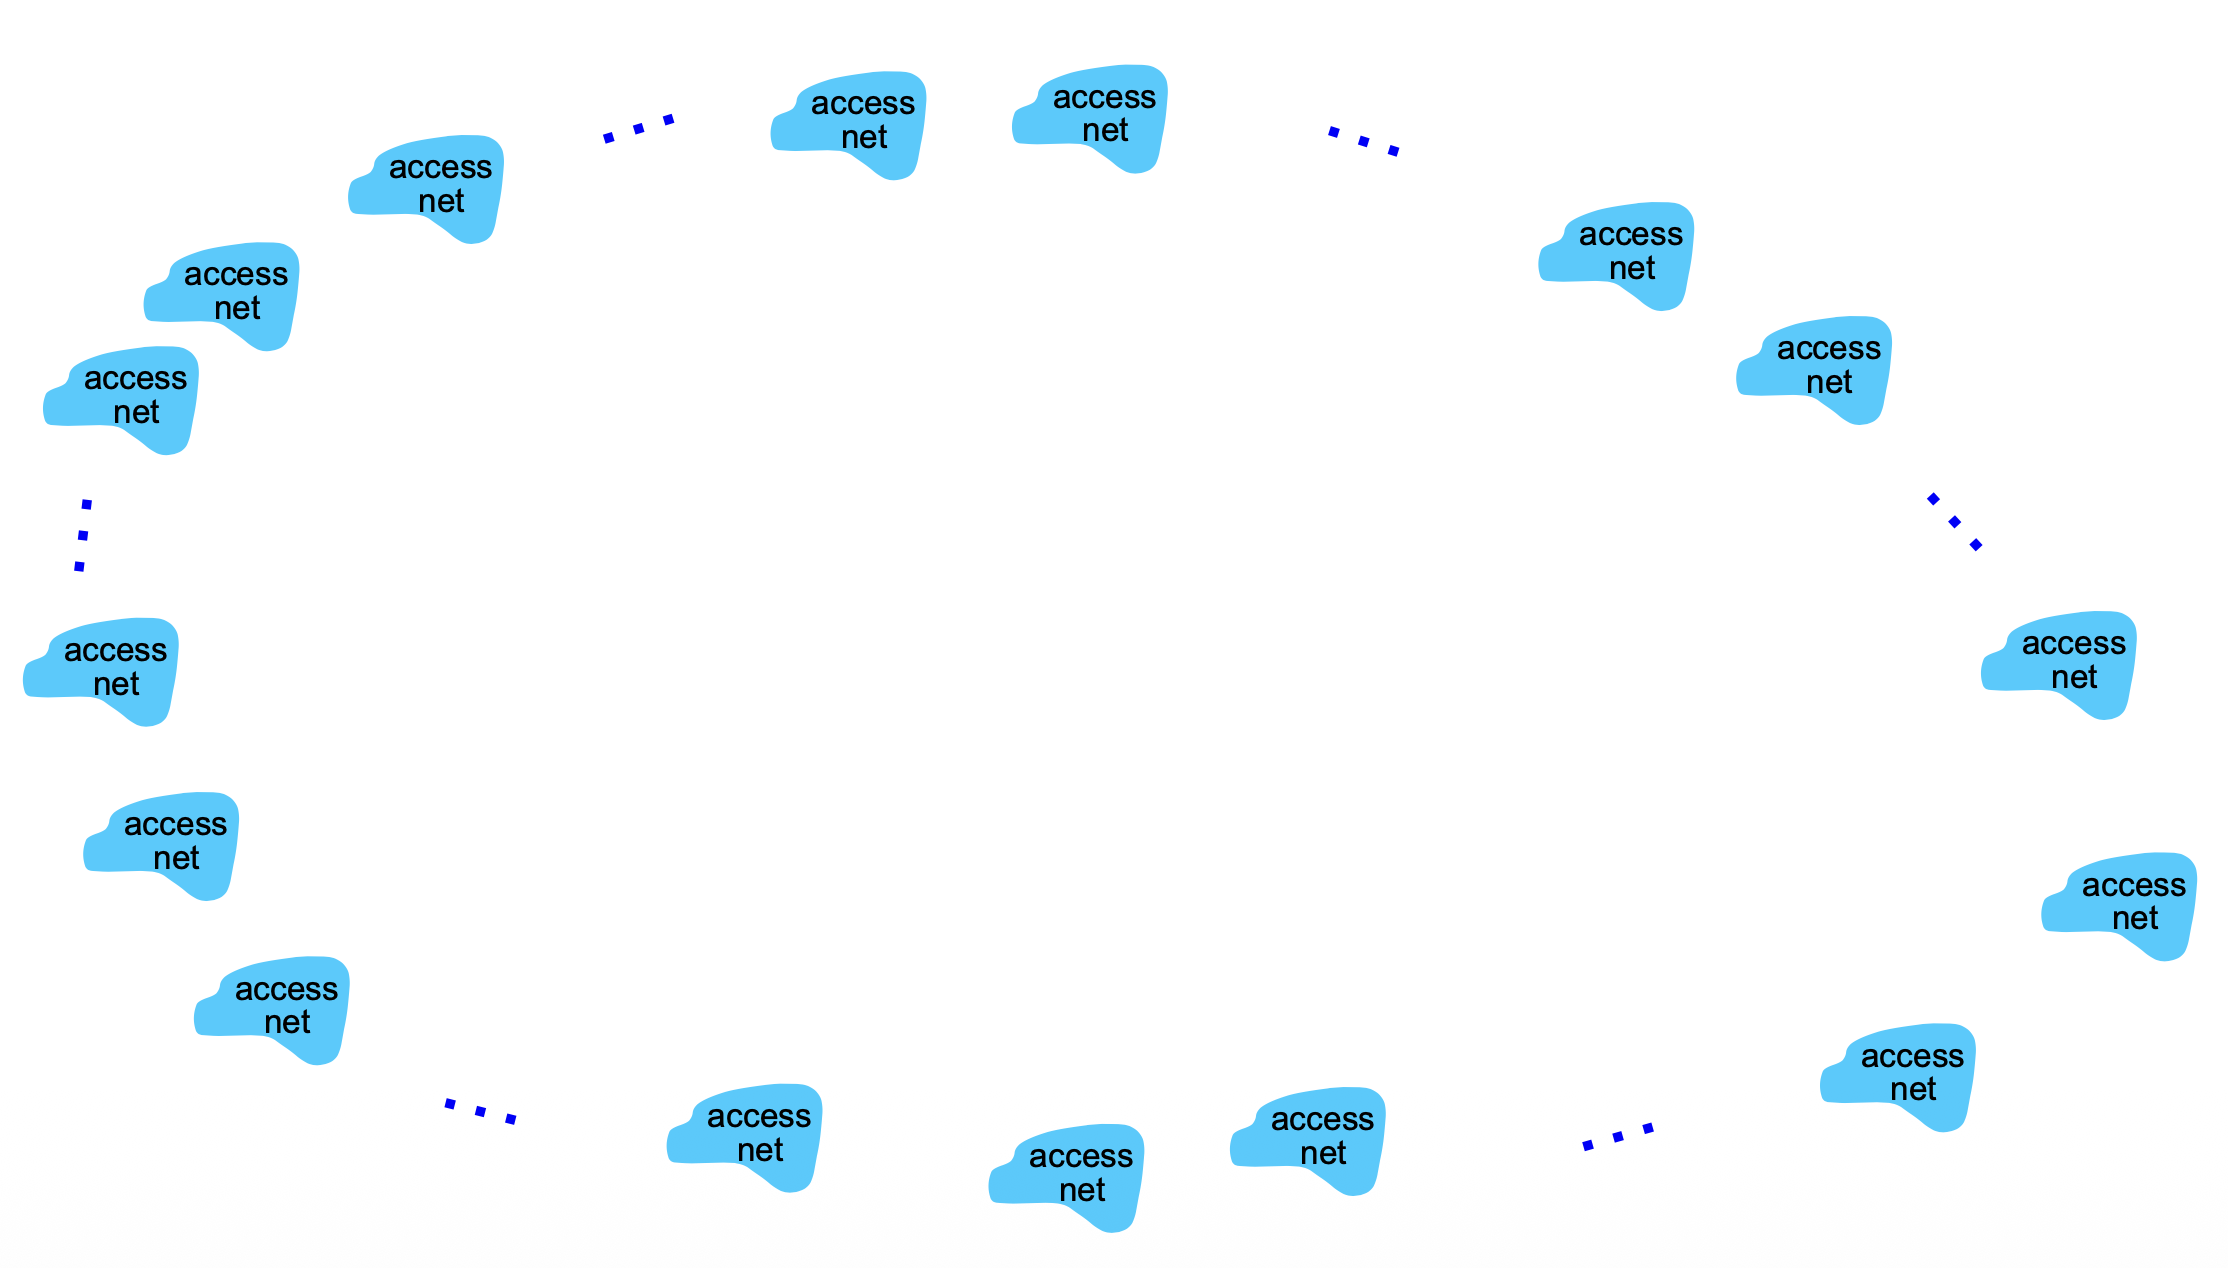
อีกฝั่งอาจจะเป็น AIS อีกฝั่งเป็น AT&T (US) ก็ได้ เราจะเชื่อกันโดยตรงเลยก็ได้
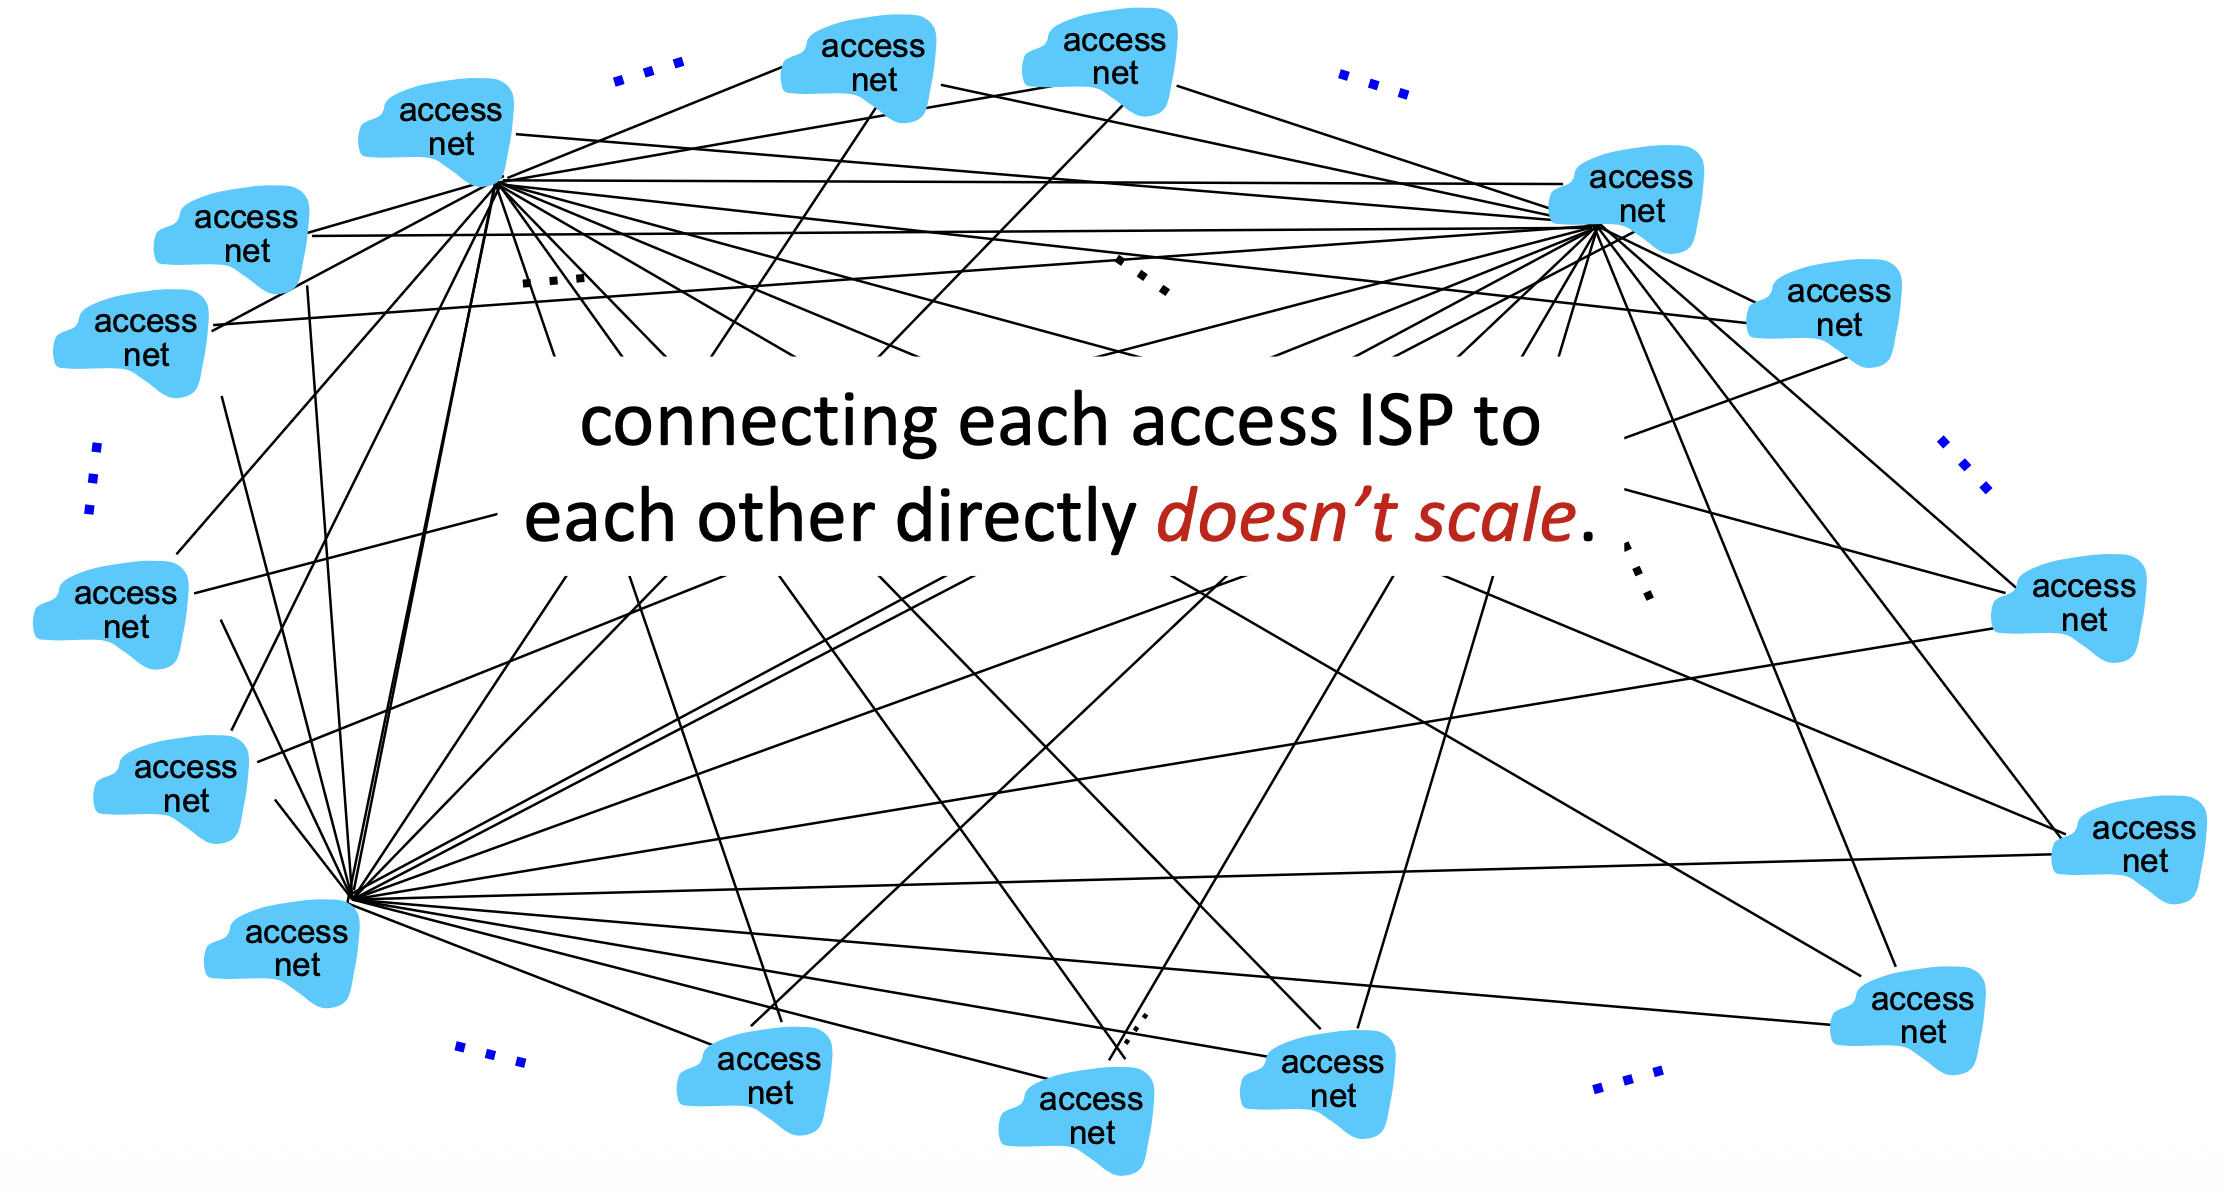
ซึ่งห่วยไง เพราะคิดว่า AIS จะเชื่อมไปหาได้ทุกที่บนโลกเลยหรอ?
Problem: Connecting each access ISP to each other directly doesn't scale.
Global Transit ISP
Option: Connect each access ISP to one global transit ISP
- Customer and provider ISPs have economic agreement
Image: Star topology with global ISP in center connected to many access networks
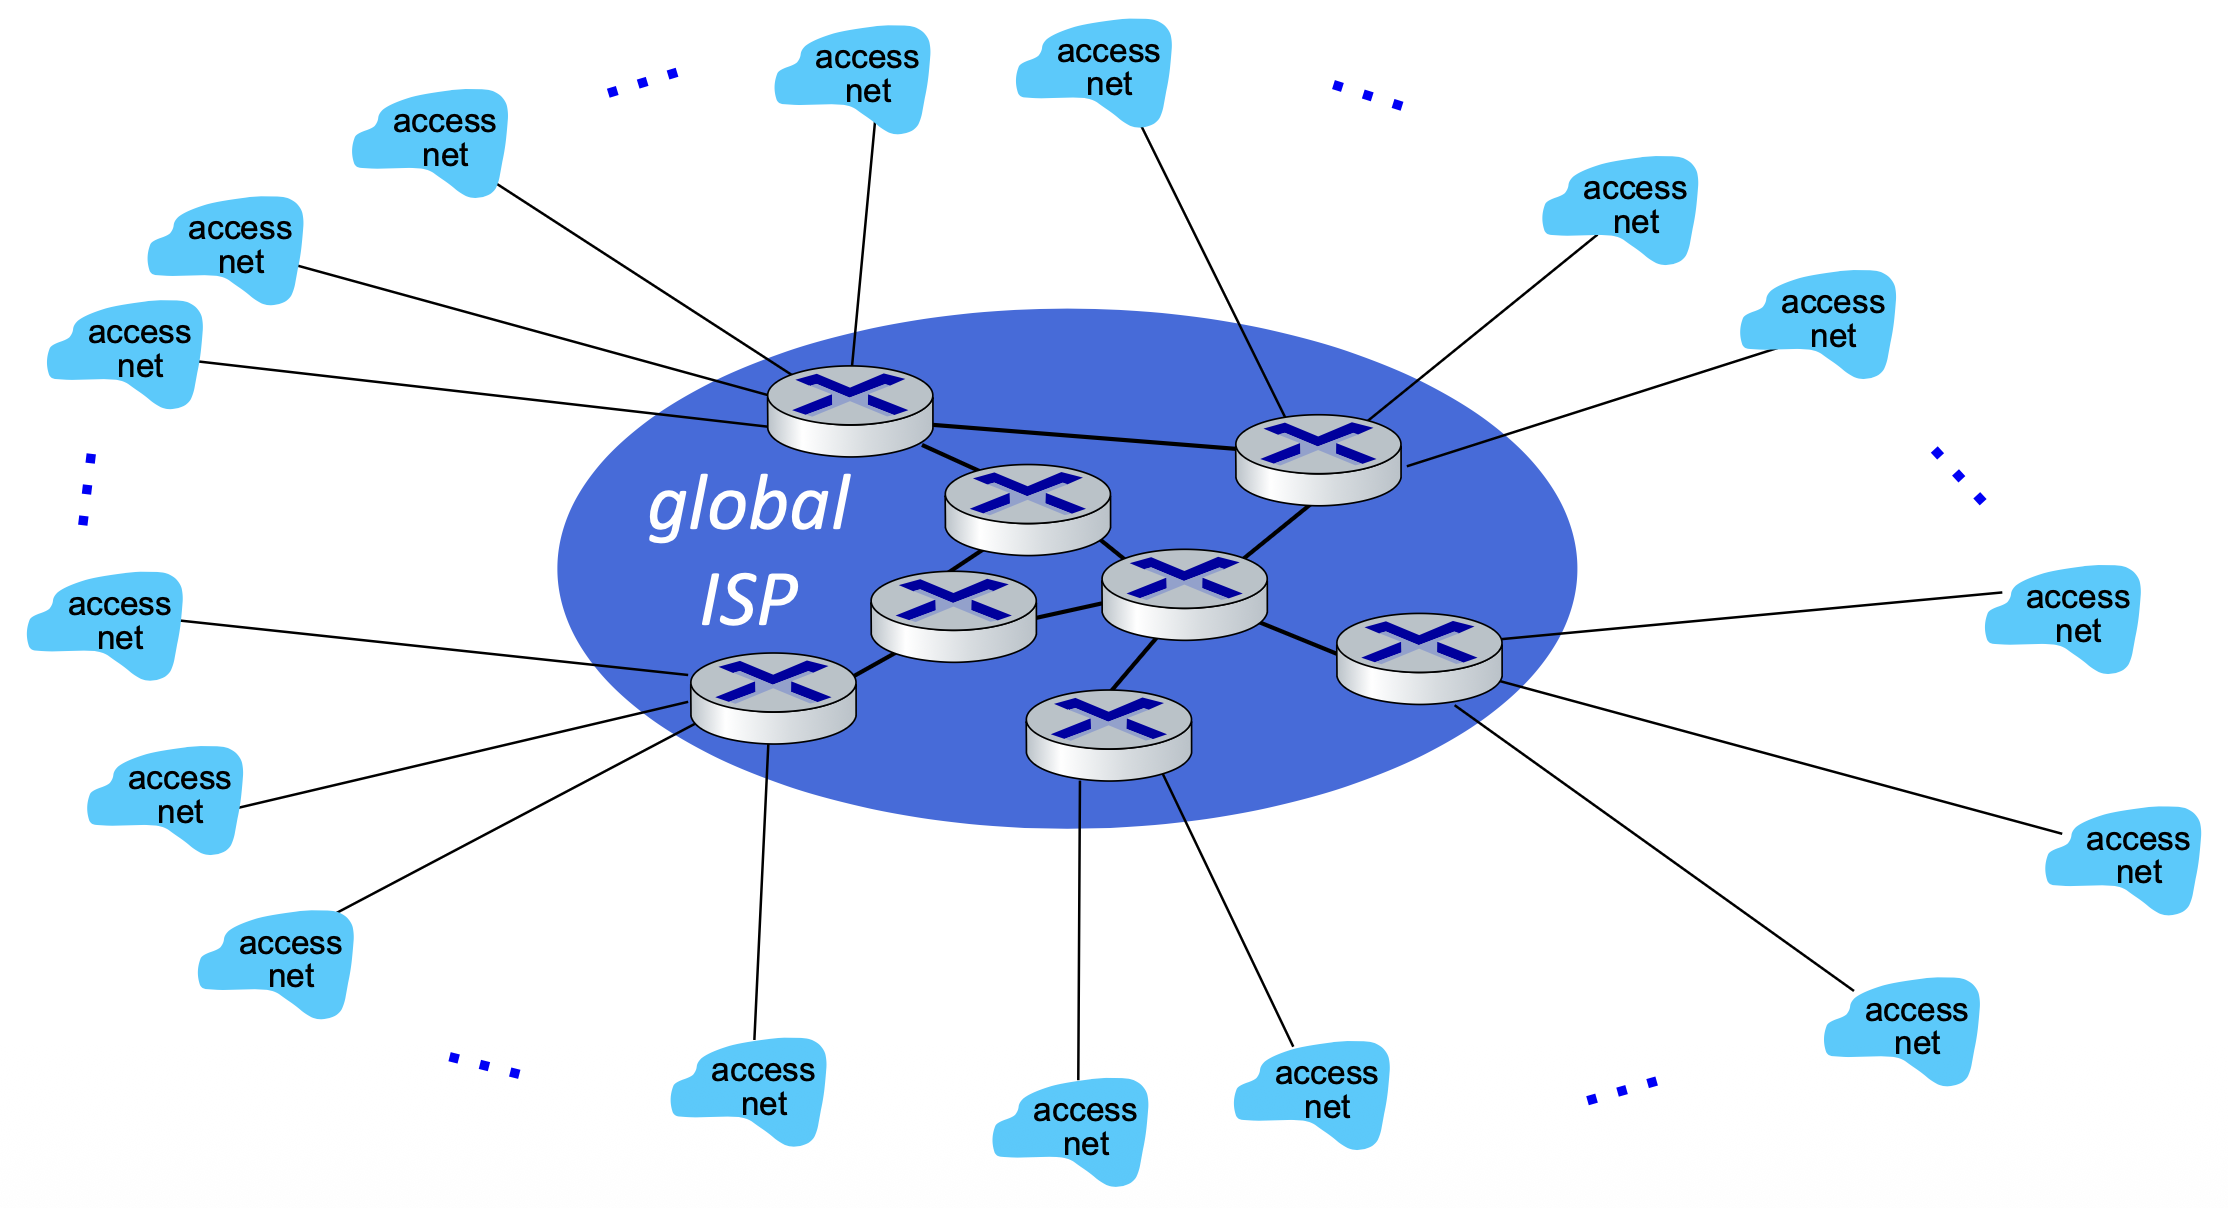
ใครจะเป็นเจ้าของ Global ISP ล่ะ? ยากมากนะจะให้เป็นแค่ บริษัท เดียวอะ
Multiple ISPs
But if one global ISP is viable business, there will be competitors...
Image: Three ISPs (ISP A, ISP B, ISP C) each with their own access networks
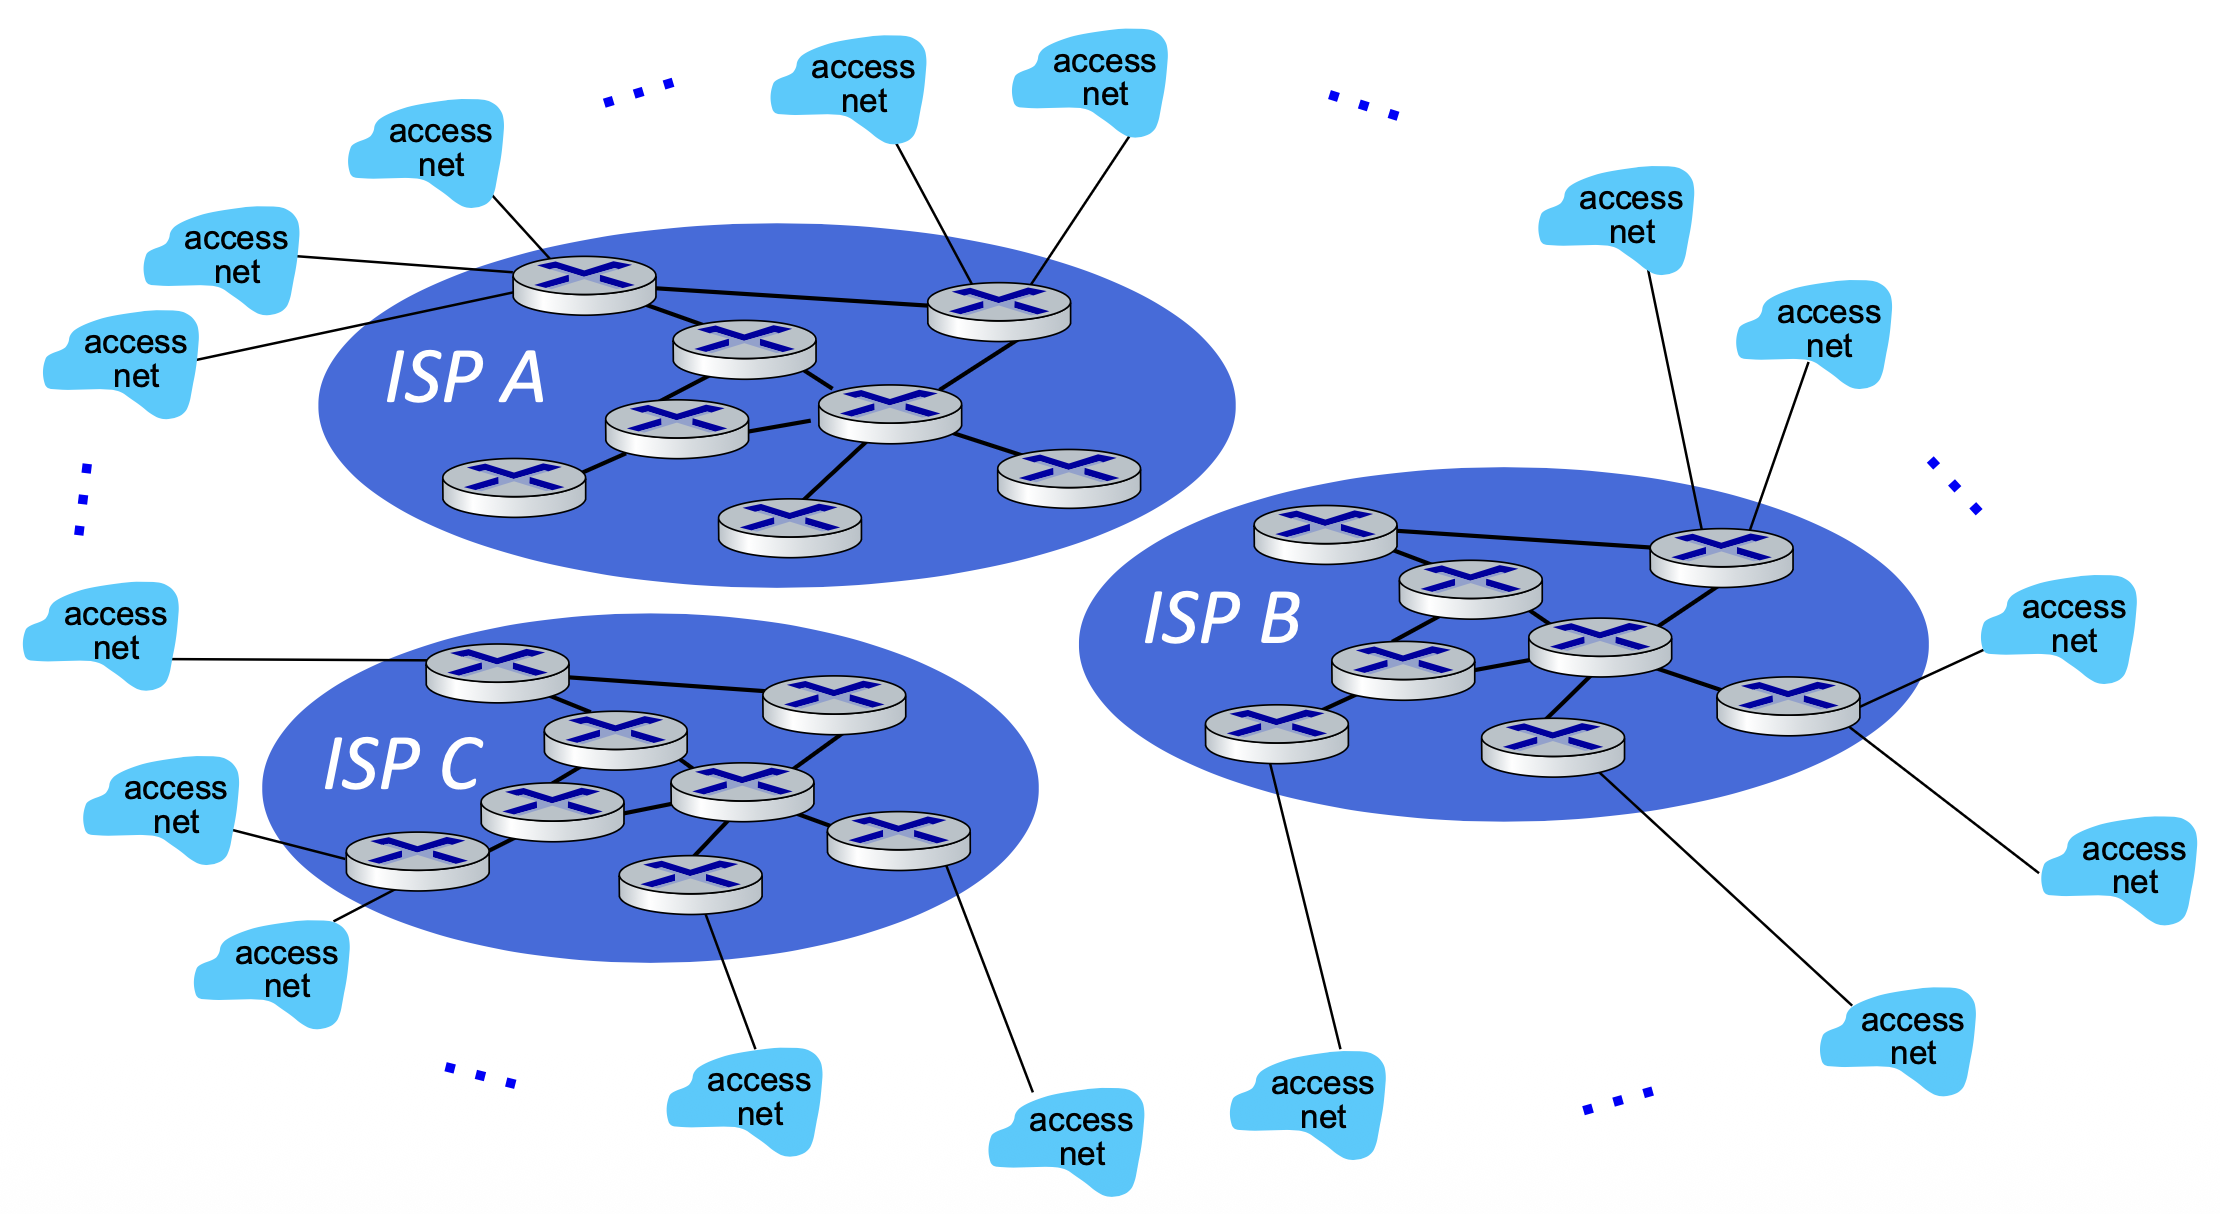
Communicate in the same group ก็จะไม่มีปัญหาอะไร แต่ถ้านอก group มันจะไม่เวิร์คอะสิ แบ่งออกเป็น three set of internet แบบนี้อะ เข้าถึงกันไม่ได้เล
Who will want to be connected:
Image: Three ISPs connected through IXP (Internet Exchange Point) and peering links
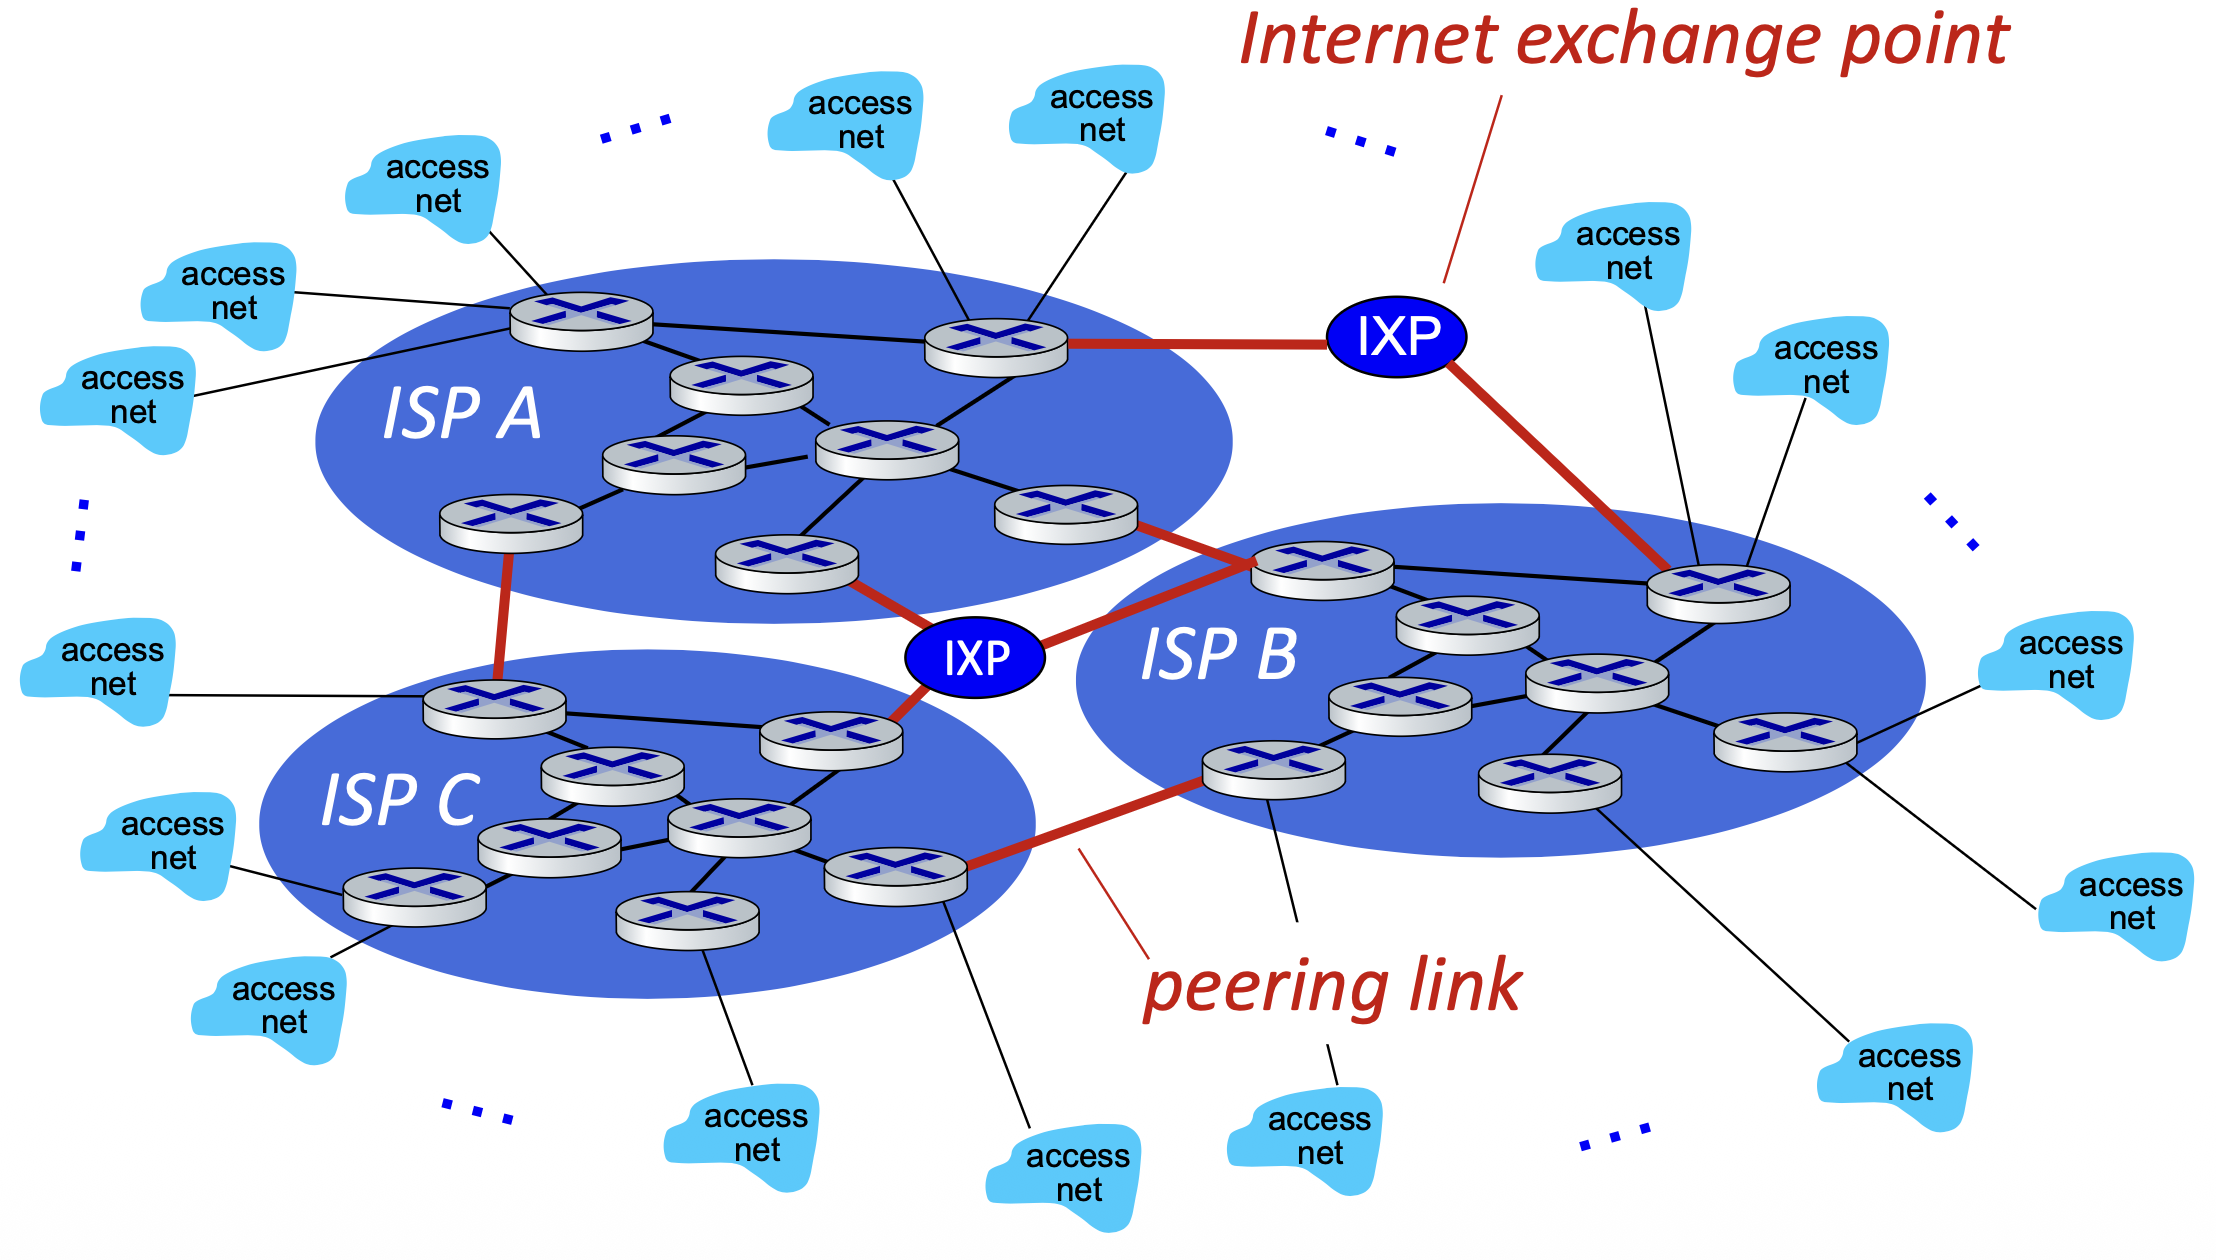
Key Components:
- IXP - Internet Exchange Point
- เราจะ operate ไอ่ตัวนี้ยังไง → ก็มี Company ที่ทำหน้าที่เป็น Internet exchange point (IXP)
- ซึ่งก็คงมีได้ส่วนแบ่ง แบ่งหุ้นกัน 50% 50% ไรงี้ 5555
- Peering link
- ถ้าเป็นสำหรับ IXP คือต้องส่งไปผ่าน Middleman
- แต่ Peering link ก็เชื่อมโดยตรงเลย ไม่ต้องผ่านใครก่อน แต่ก็ต้องคุยอยู่ดี ใครจ่าย พวก infrastructure ในส่วนตรงนี้ล่ะ ทุกกอย่างเป็นเงินเป็นทองนะ
IXP vs Peering Link
| Topic | IXP (Internet Exchange Point) | Peering Link (Private Peering) |
|---|---|---|
| Connection Type | Many networks connect through shared switches | Only two networks connect directly |
| Topology | Exchange fabric used by all members | Point-to-point dedicated link |
| Cost | Cheaper (shared cost) | More expensive (private link) |
| Scalability | Very scalable (many peers) | Scales only between two networks |
| Performance | Good, but shared | Excellent, dedicated bandwidth |
| Use Case | Local ISPs exchange domestic traffic | Heavy traffic between two specific networks |
| Example | BKNIX, SGIX | ISP ↔ Google, ISP ↔ Meta direct links |
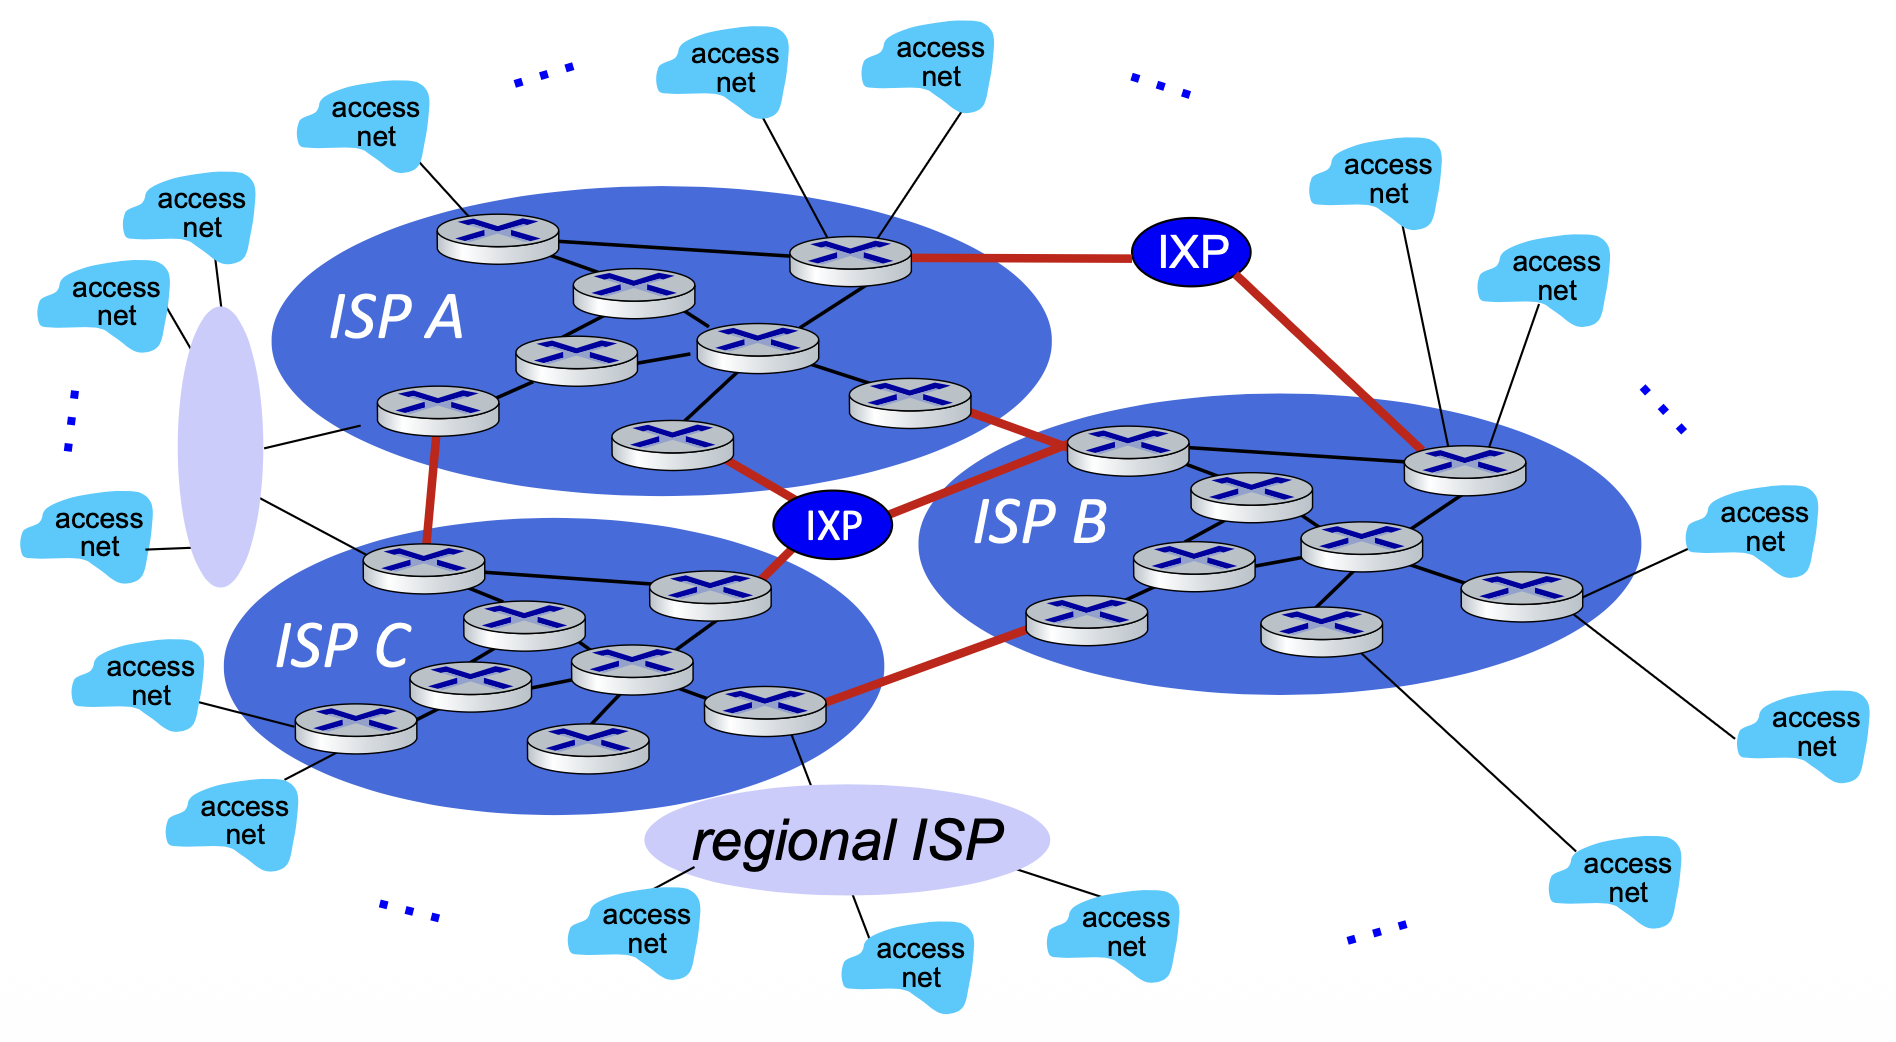
Regional Networks
...and regional networks may arise to connect access nets to ISPs
Image: Three ISPs with IXPs, plus regional ISP layer connecting access networks
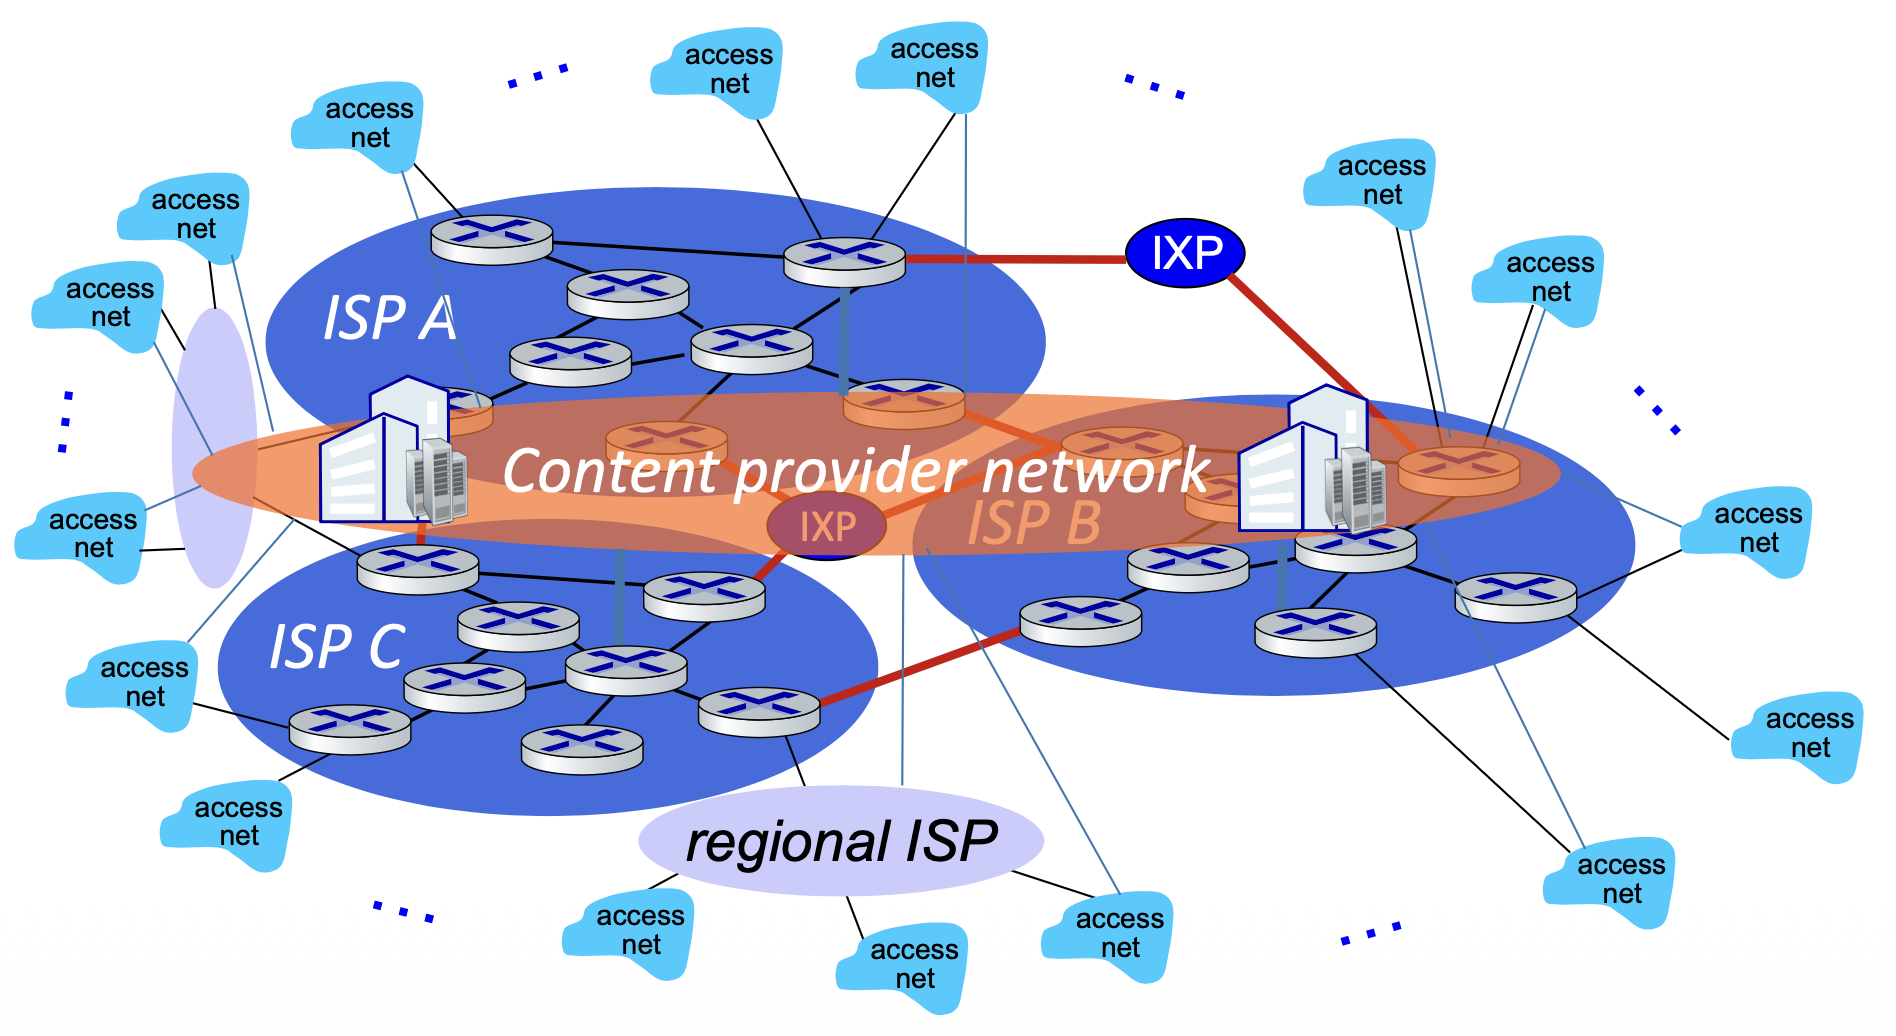
Content Provider Networks
...and content provider networks (e.g., Google, Microsoft, Akamai) may run their own network, to bring services, content close to end users
Image: Complete internet structure with ISPs, IXPs, regional ISP, and Content provider network layer
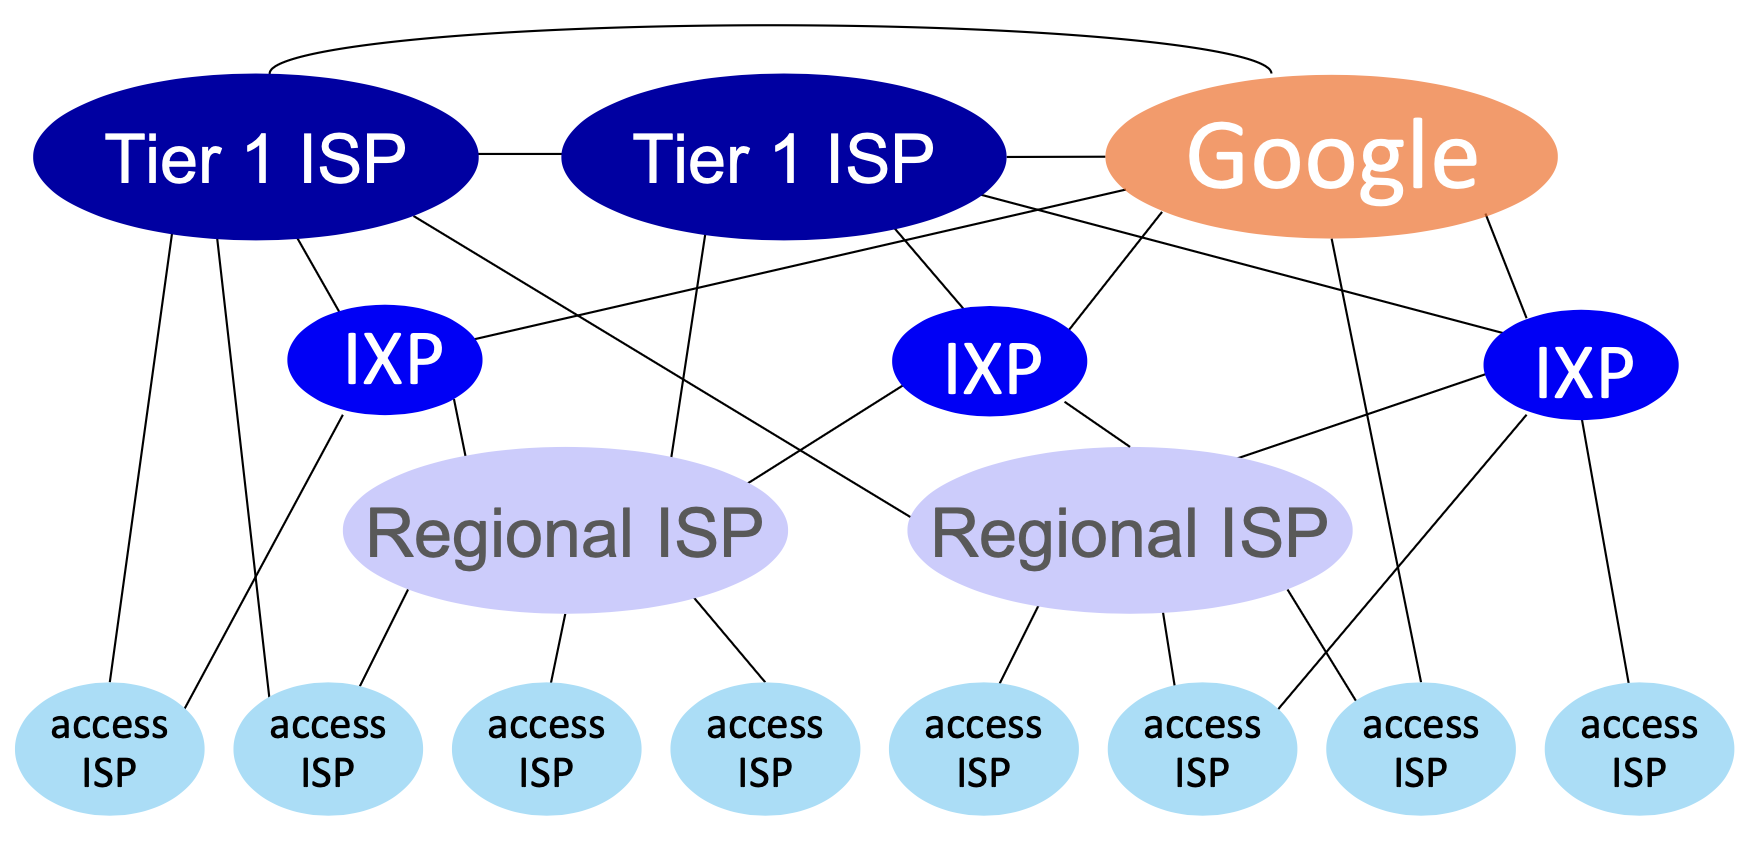
Complete Internet Structure
At "center": small # of well-connected large networks
- "Tier-1" commercial ISPs (e.g., Level 3, Sprint, AT&T, NTT)
- National & international coverage
- Content provider networks (e.g., Google, Facebook)
- Private network that connects its data centers to Internet
- Often bypassing tier-1, regional ISPs
Image: Final internet structure with access ISPs, Regional ISPs, Tier 1 ISPs, IXPs, and Google content provider network
ISP Tier Categories
Tier-1 ISP/Backbone Providers
- Nationwide or multinational organization that control Internet routing
- Normally own significant pieces of backbone itself
- Settlement-free interconnection (without paying any fees)
Tier-2 ISP/National Provider
- These ISPs buy capacity (bandwidth) and routing services from Tier-1
- Run Point of Presence (POP) across the country
- Purchases IP transit to reach some portion of the Internet from Tier-1
Tier-3 ISP/Local Provider
- These ISPs operate in the same way with Tier-2 but on a smaller geographical area
- Purchases IP transit to reach Internet from Tier-2 (Difficult to buy from Tier-1)
Tier-2 ก็ pay ให้ Tier-1 แล้ว Tier-2 ก็เอาที่ได้ไปขายต่อ เอากำไรให้ได้
Tier Interconnections
Image: ISP tier interconnection diagram showing Tier 1 Networks, Tier 2 Networks, Tier 2 ISP, Tier 3 Networks (multi-homed ISP and single homed ISP), with PoPs (Point of Presence), IXP, Transit and Peering connections
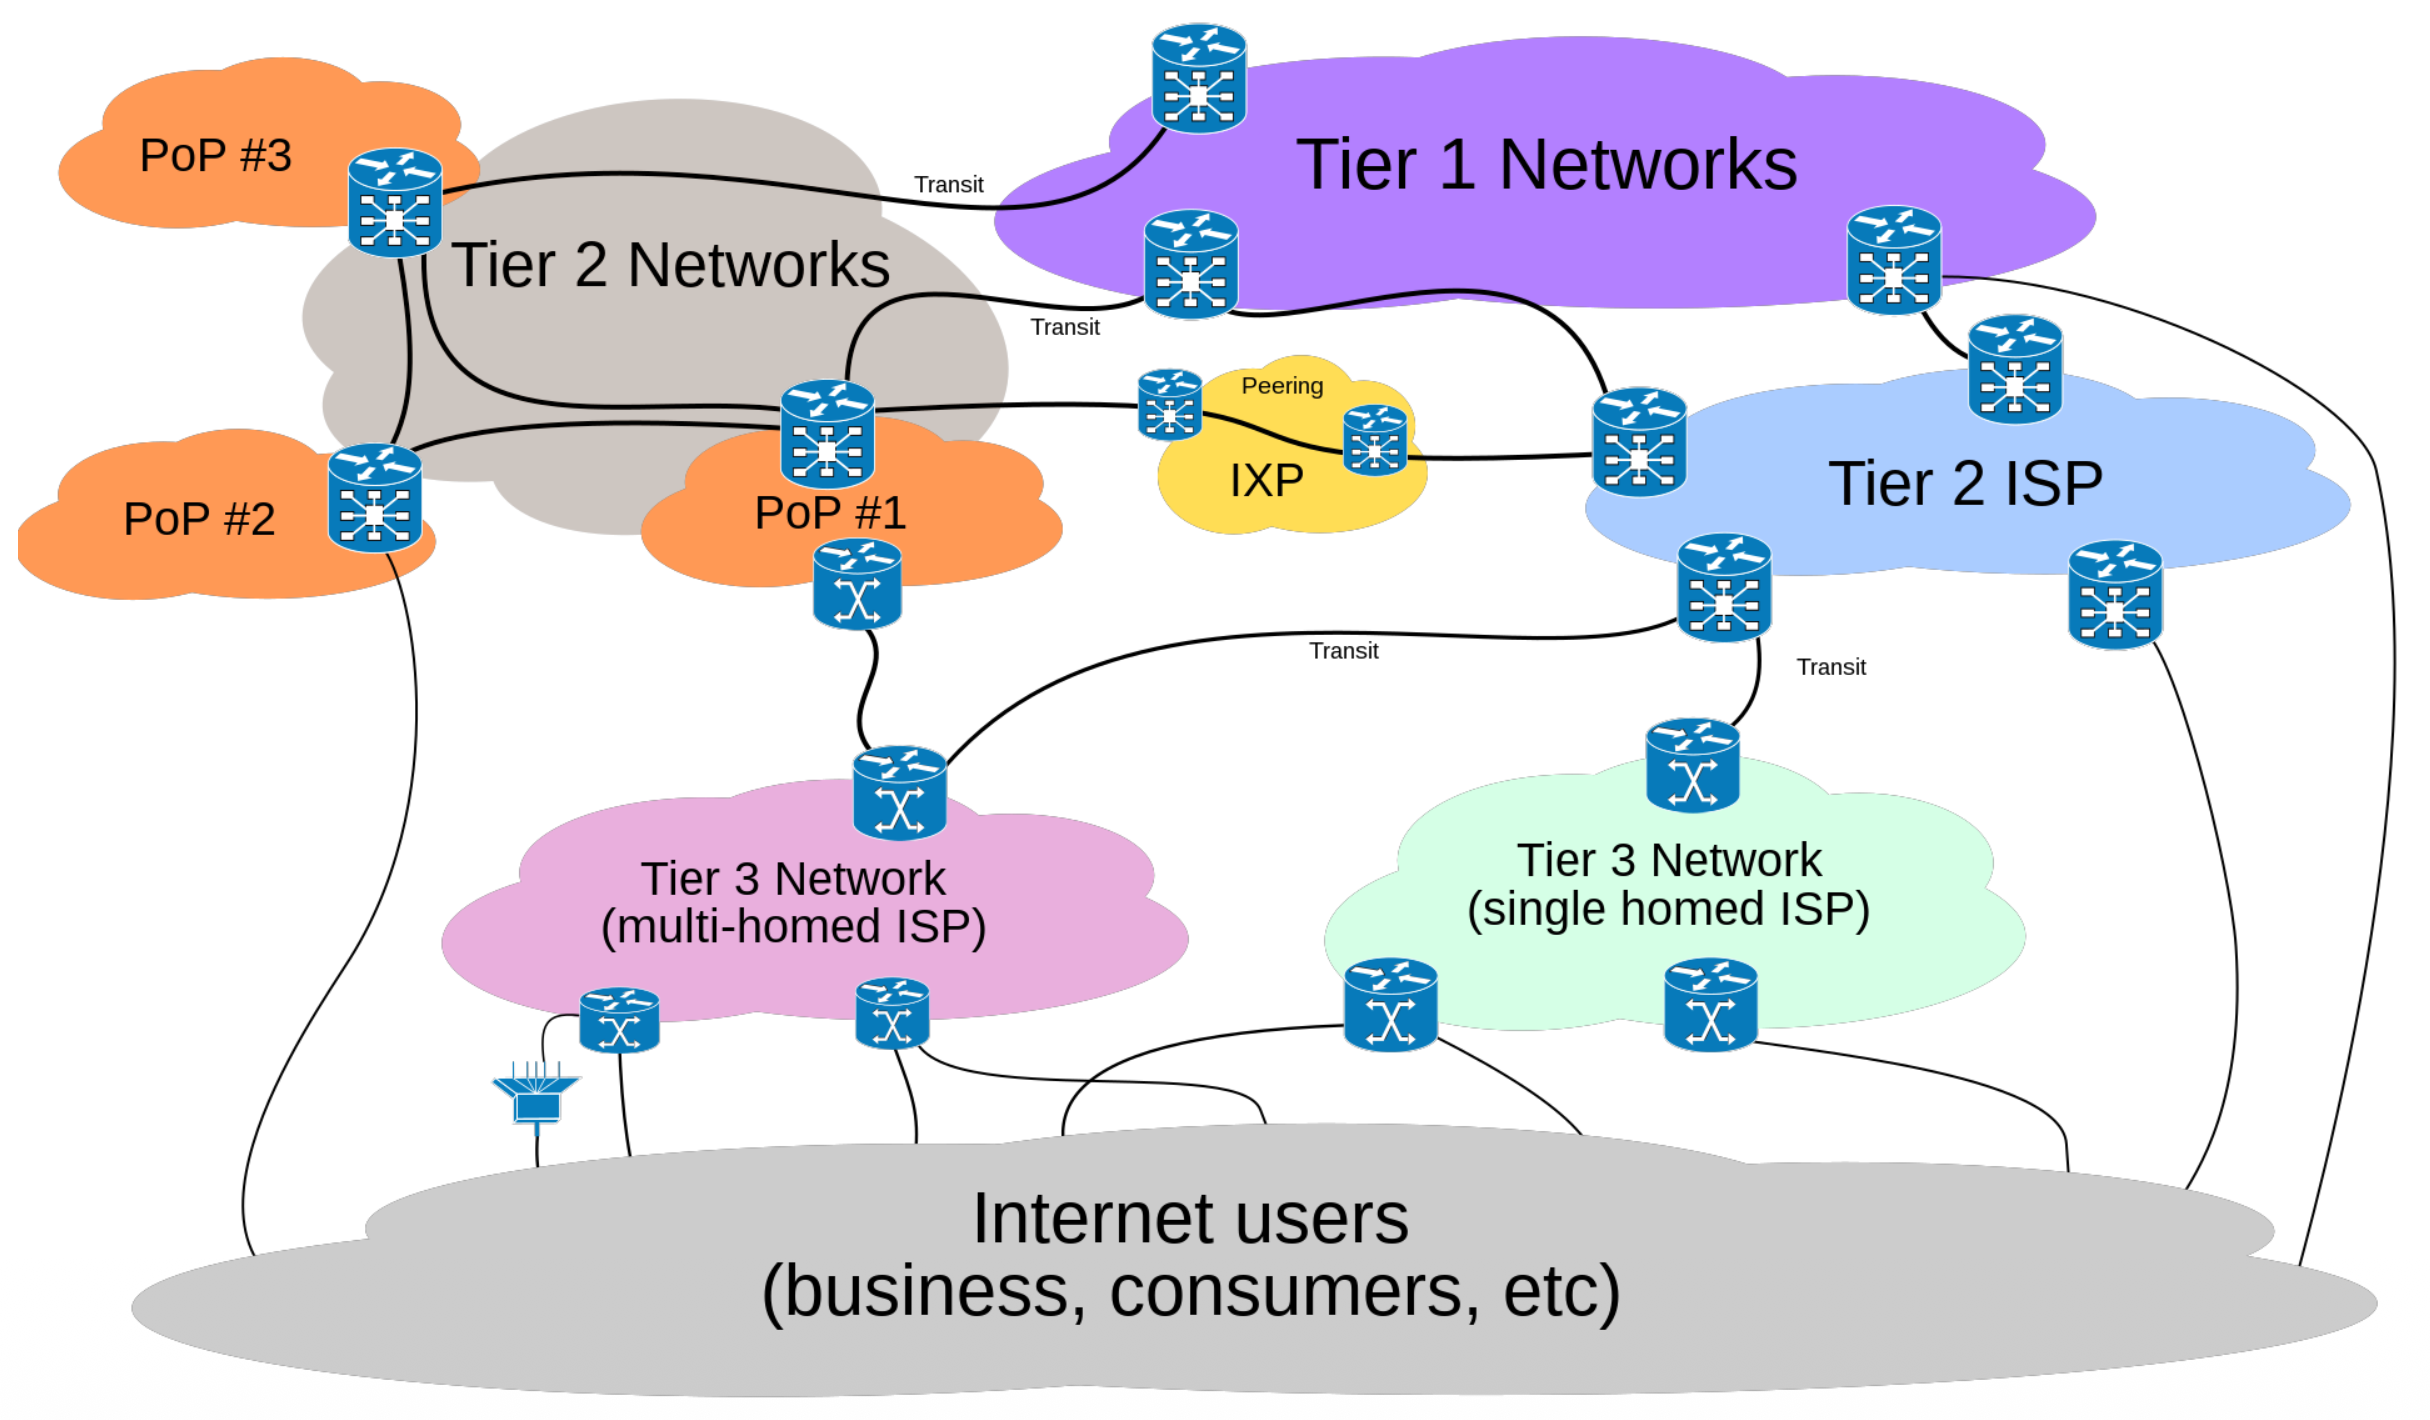
Key Terms:
- PoP - Point of Presence
- Transit - Paid connection to upper tier
- Peering - Free exchange between similar tiers
- IXP - Internet Exchange Point
Tier 3 Network Detail
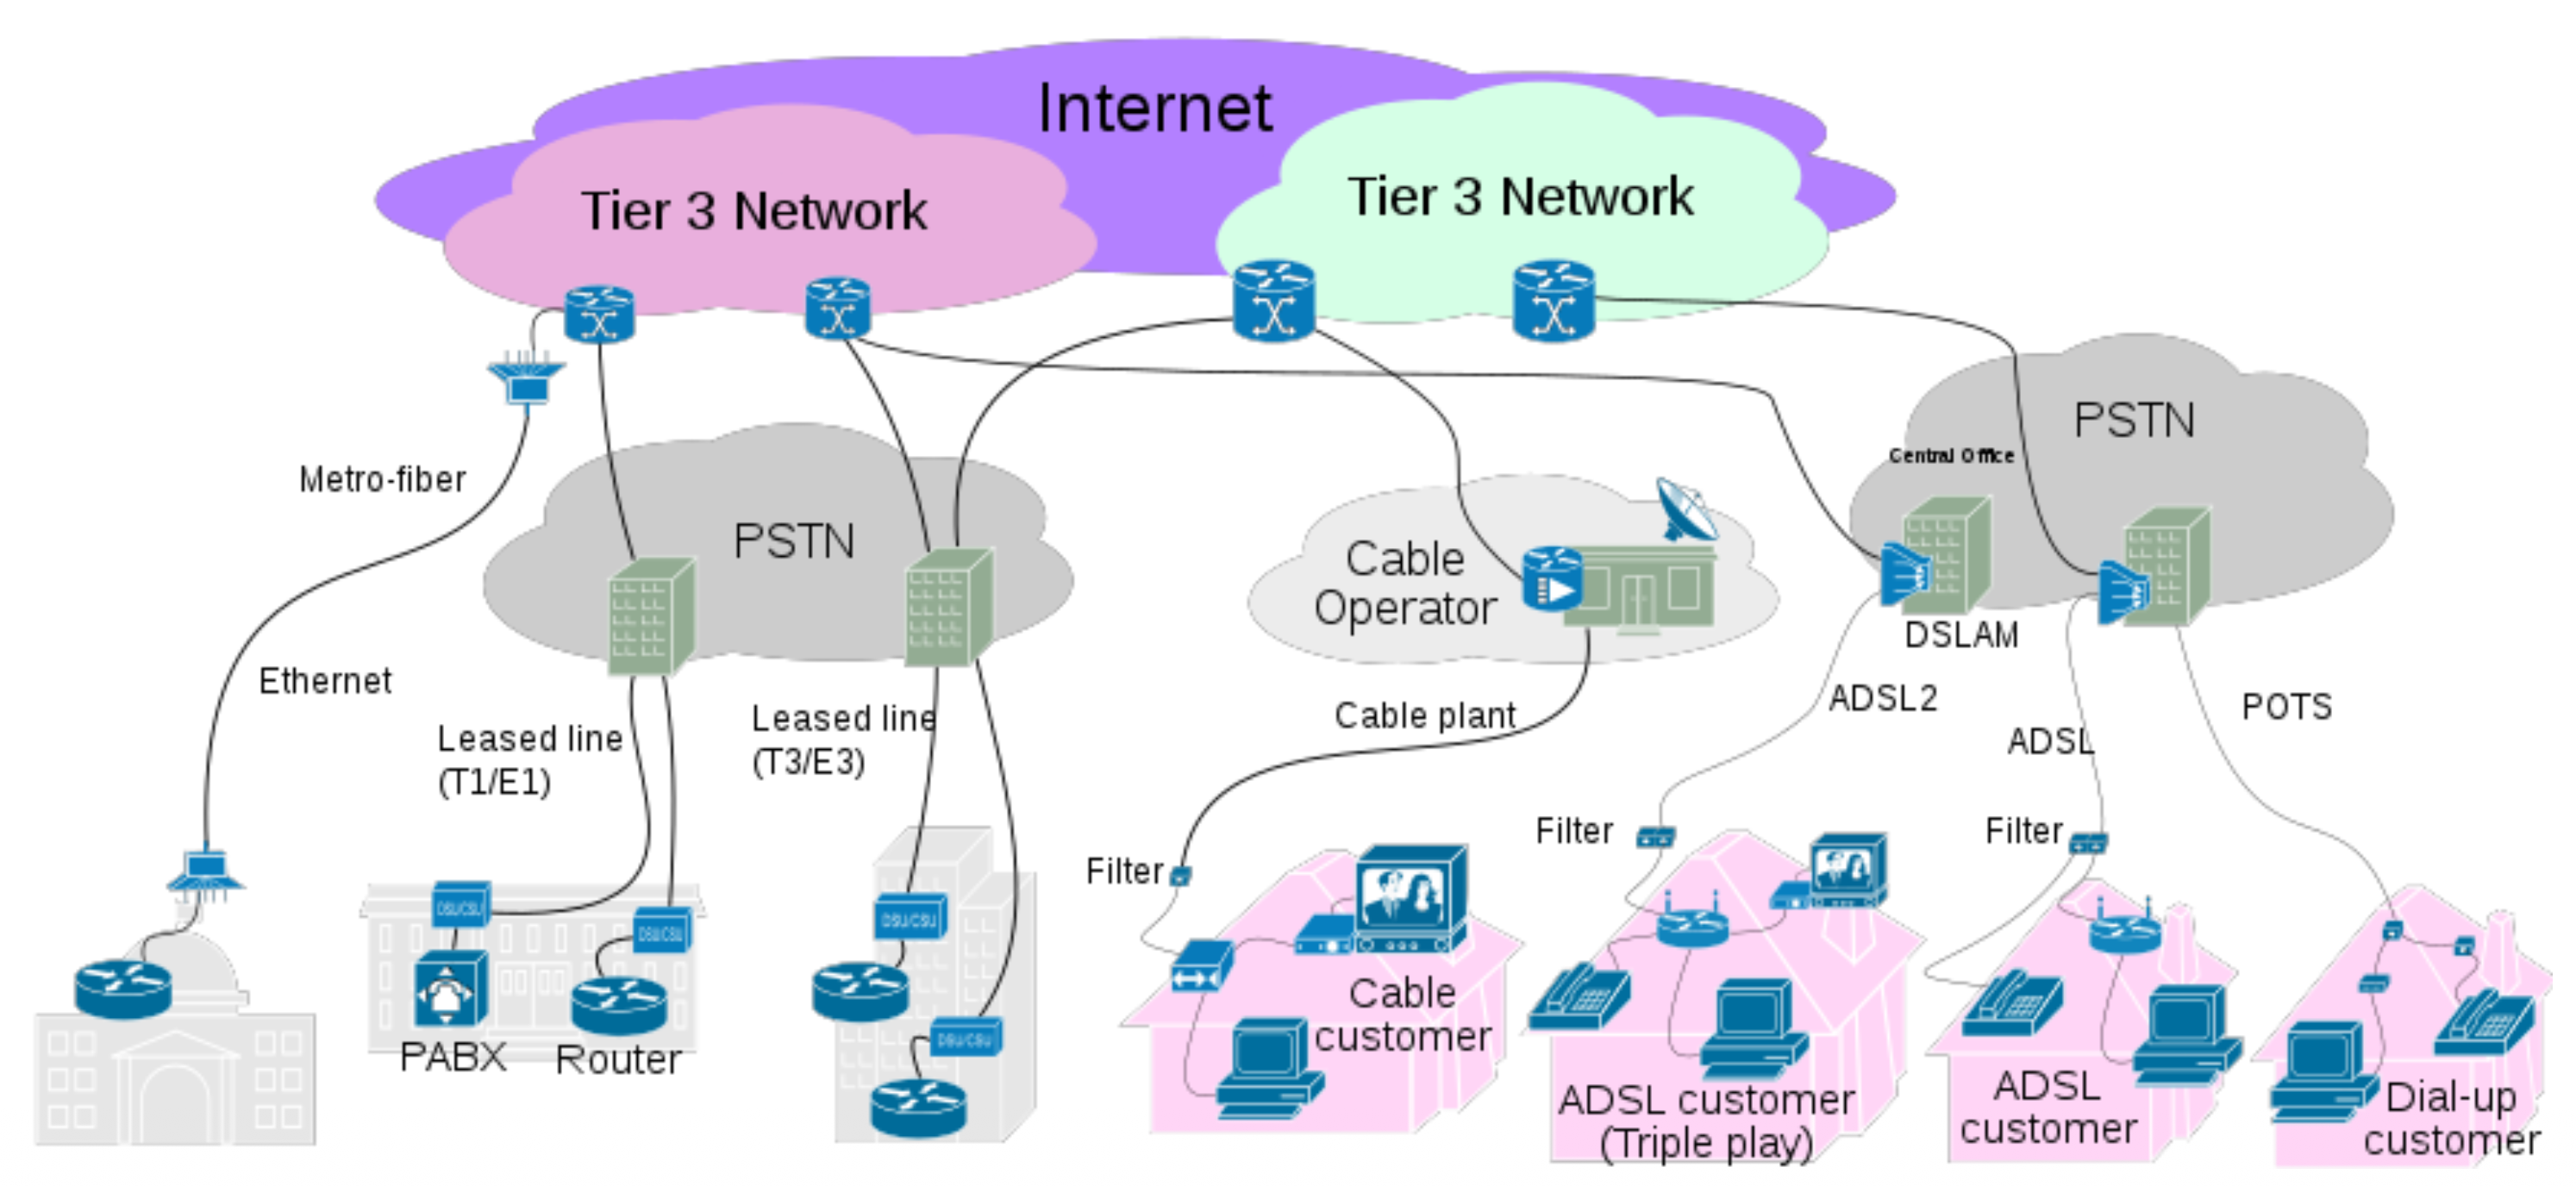
Image: Detailed Tier 3 network showing PSTN (Public Switched Telephone Network), Cable Operator, Metro-fiber, Ethernet, Leased lines (T1/E1, T3/E3), DSLAM, ADSL2, ADSL, POTS, Filters, and various customer types (Cable customer, ADSL customer, Dial-up customer)
Global ISP Tier Map
Image: World map showing ISP Tiers with Tier 1 (AT&T, Verizon, CenturyLink), Tier 2 (BT, Comcast, KCOM), and Tier 3 ISPs marked globally, showing Private Internet, Public Internet, Public Cloud, Data Centre/Private Cloud connections
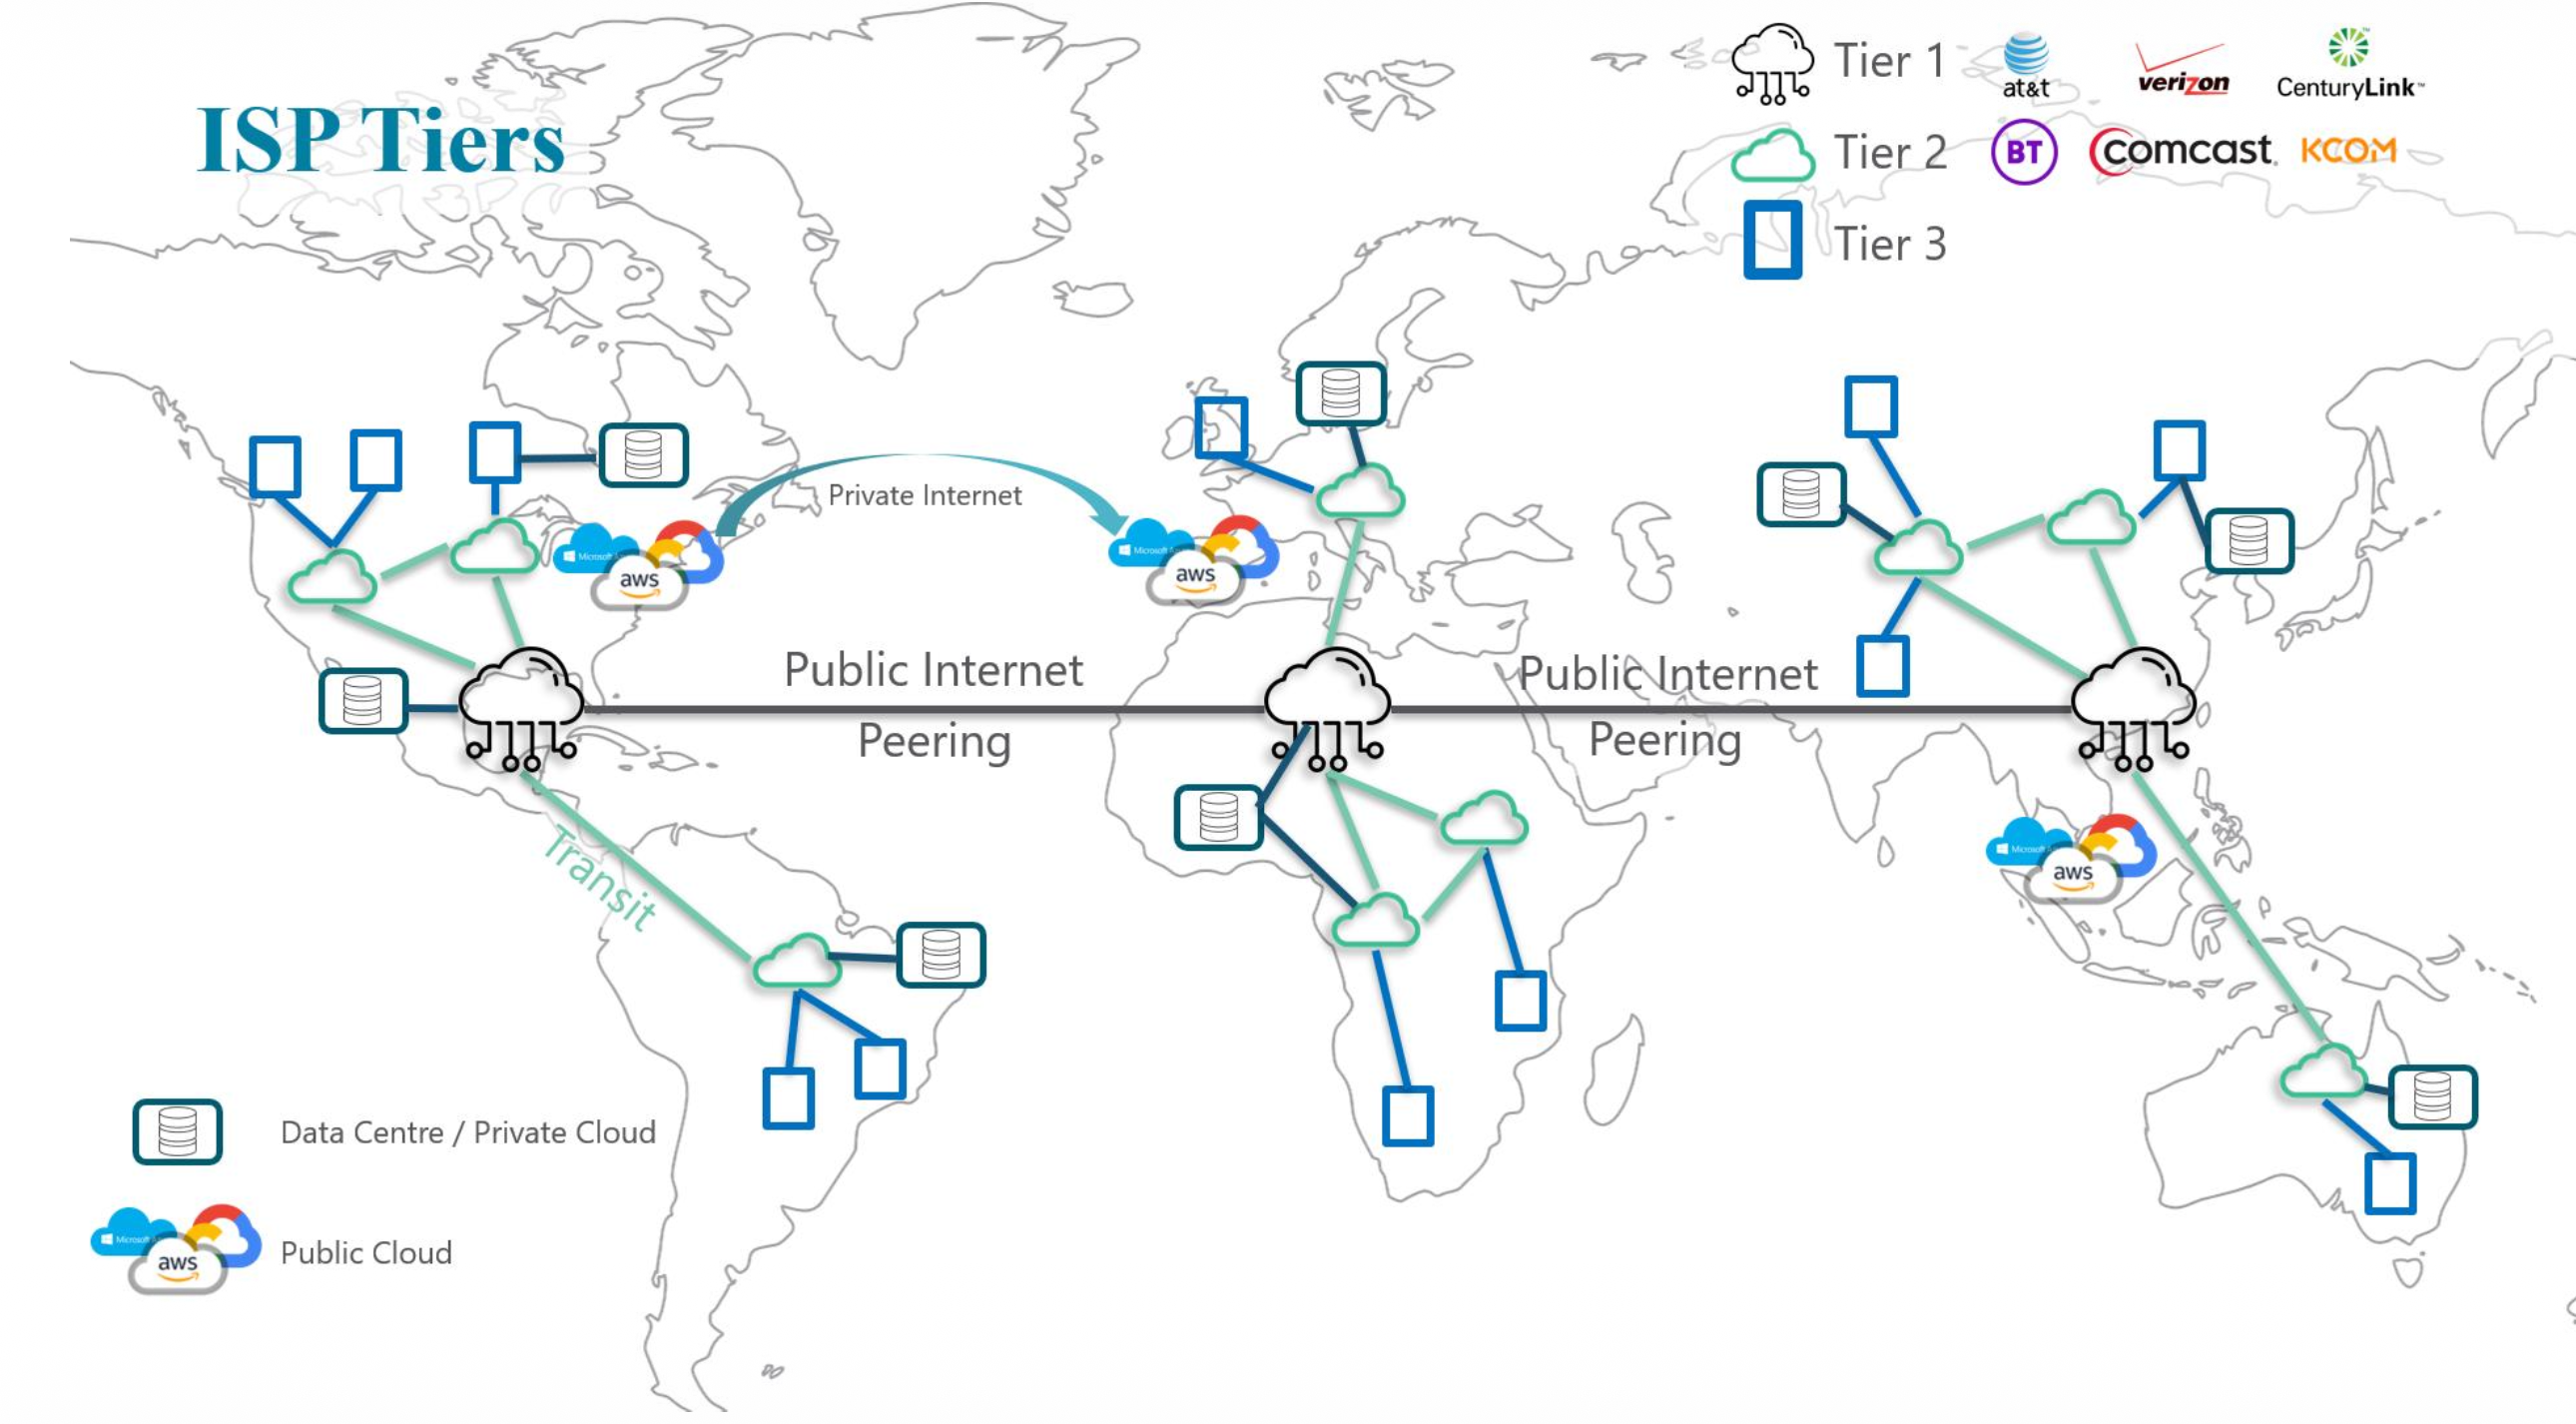
AWS ก็เวลาเราตอนตั้ง Region ของ Cloud ไง (ส่วนใหญ่จะตั้ง Server ไว้ใน Tier 1 เพราะทุกคนวิ่งเข้าหาไง)
Thailand Internet Maps
Domestic Internet Exchange
image: Thailand Domestic Internet Exchange map showing ISP interconnections including TCAT (CAT), AWN (AWN), CSL-IX, AIS Tel-IX, SYM-IX (Symphony), AWN-IX, TLCCT-IX, TICT-IX (TOT), DTAC-IX, BKNIX, IGC-IX with various connection speeds
Total Domestic Bandwidth: 10,246.655 Gbps
International Internet Gateway
image: Thailand International Internet Gateway map showing connections to various countries and regions with bandwidth capacities
Total International Bandwidth: 18,110.334 Gbps
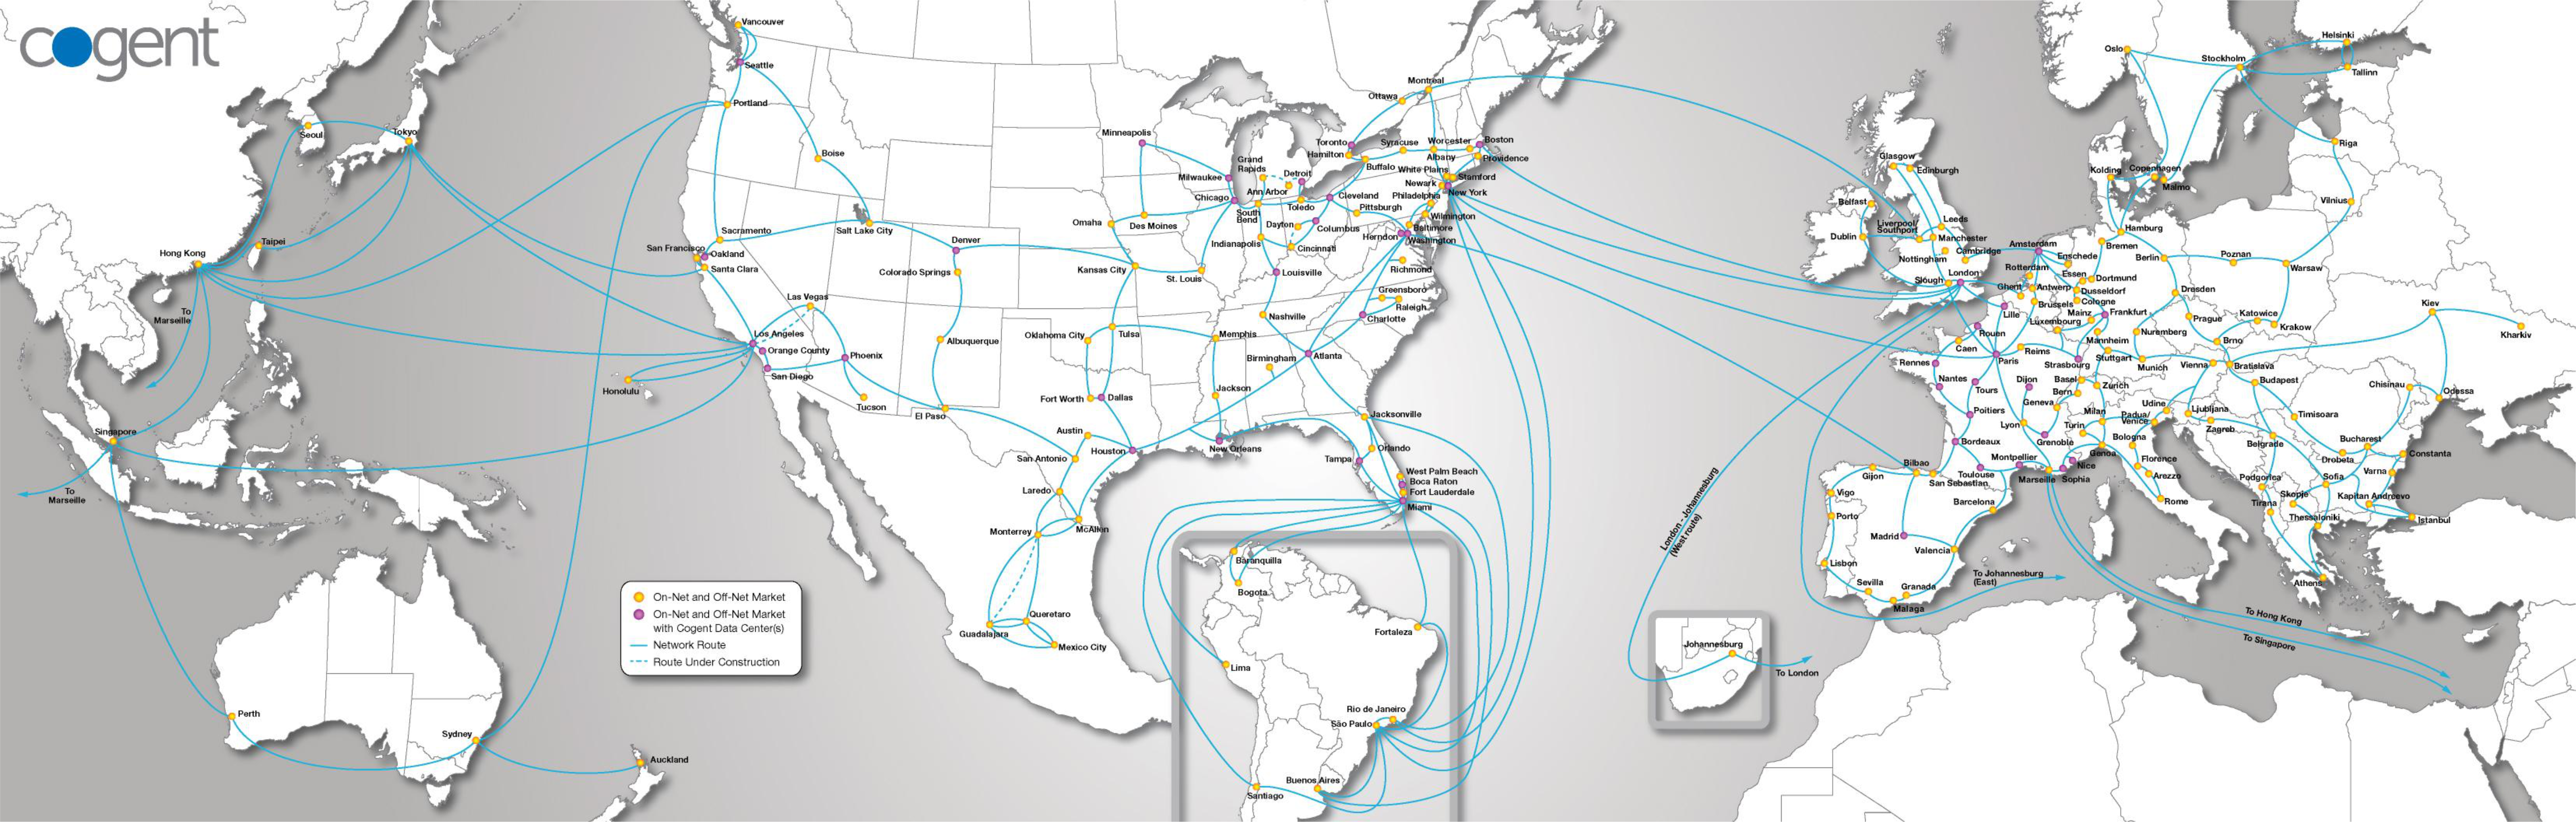
Tier 1 ISP with Submarine Cable
[[image: World map showing submarine cable connections from Asia-Pacific (Seoul, Tokyo, Hong Kong, Taipei, Singapore, Marseille) to North America (Portland, Boise, San Francisco, Oakland, Sacramento, Los Angeles, San Diego, etc.)]
Global connectivity points:
- On-Net and Off-Net Market
- On-Net and Off-Net Market with Cogent Data Centers
- Network Route
- Route Under Construction
Internet Speed vs Connection Speed
Key Differences
Connection Speed:
- Depend on both-end technology
- Wi-Fi (g) ↔ Wi-Fi (g,ac) = g (52Mb) (limited by slower device)
- Lan 100Mb ↔ Lan 1Gb = Lan 100Mb (limited by slower link)
- Wi-Fi 2.4GHz vs 5GHz
- Distance matters
- Backward compatibility (downgrade)
Internet Speed:
- Buy from ISP
- Example: Download: 500Mb, Upload: 200Mb
- Cost: 500 Baht/month
- Shared (may slow at evening)
- Access Type (Stable Connection)
- Fixed-IP?
- Less Share, Premium?
ISP Package Example
Image: 3BB Infinite Fiber packages showing 100/100 Mbps, 200/200 Mbps, 300/300 Mbps, 500/500 Mbps plans with prices 590, 700, 900, 1,200 baht/month respectively
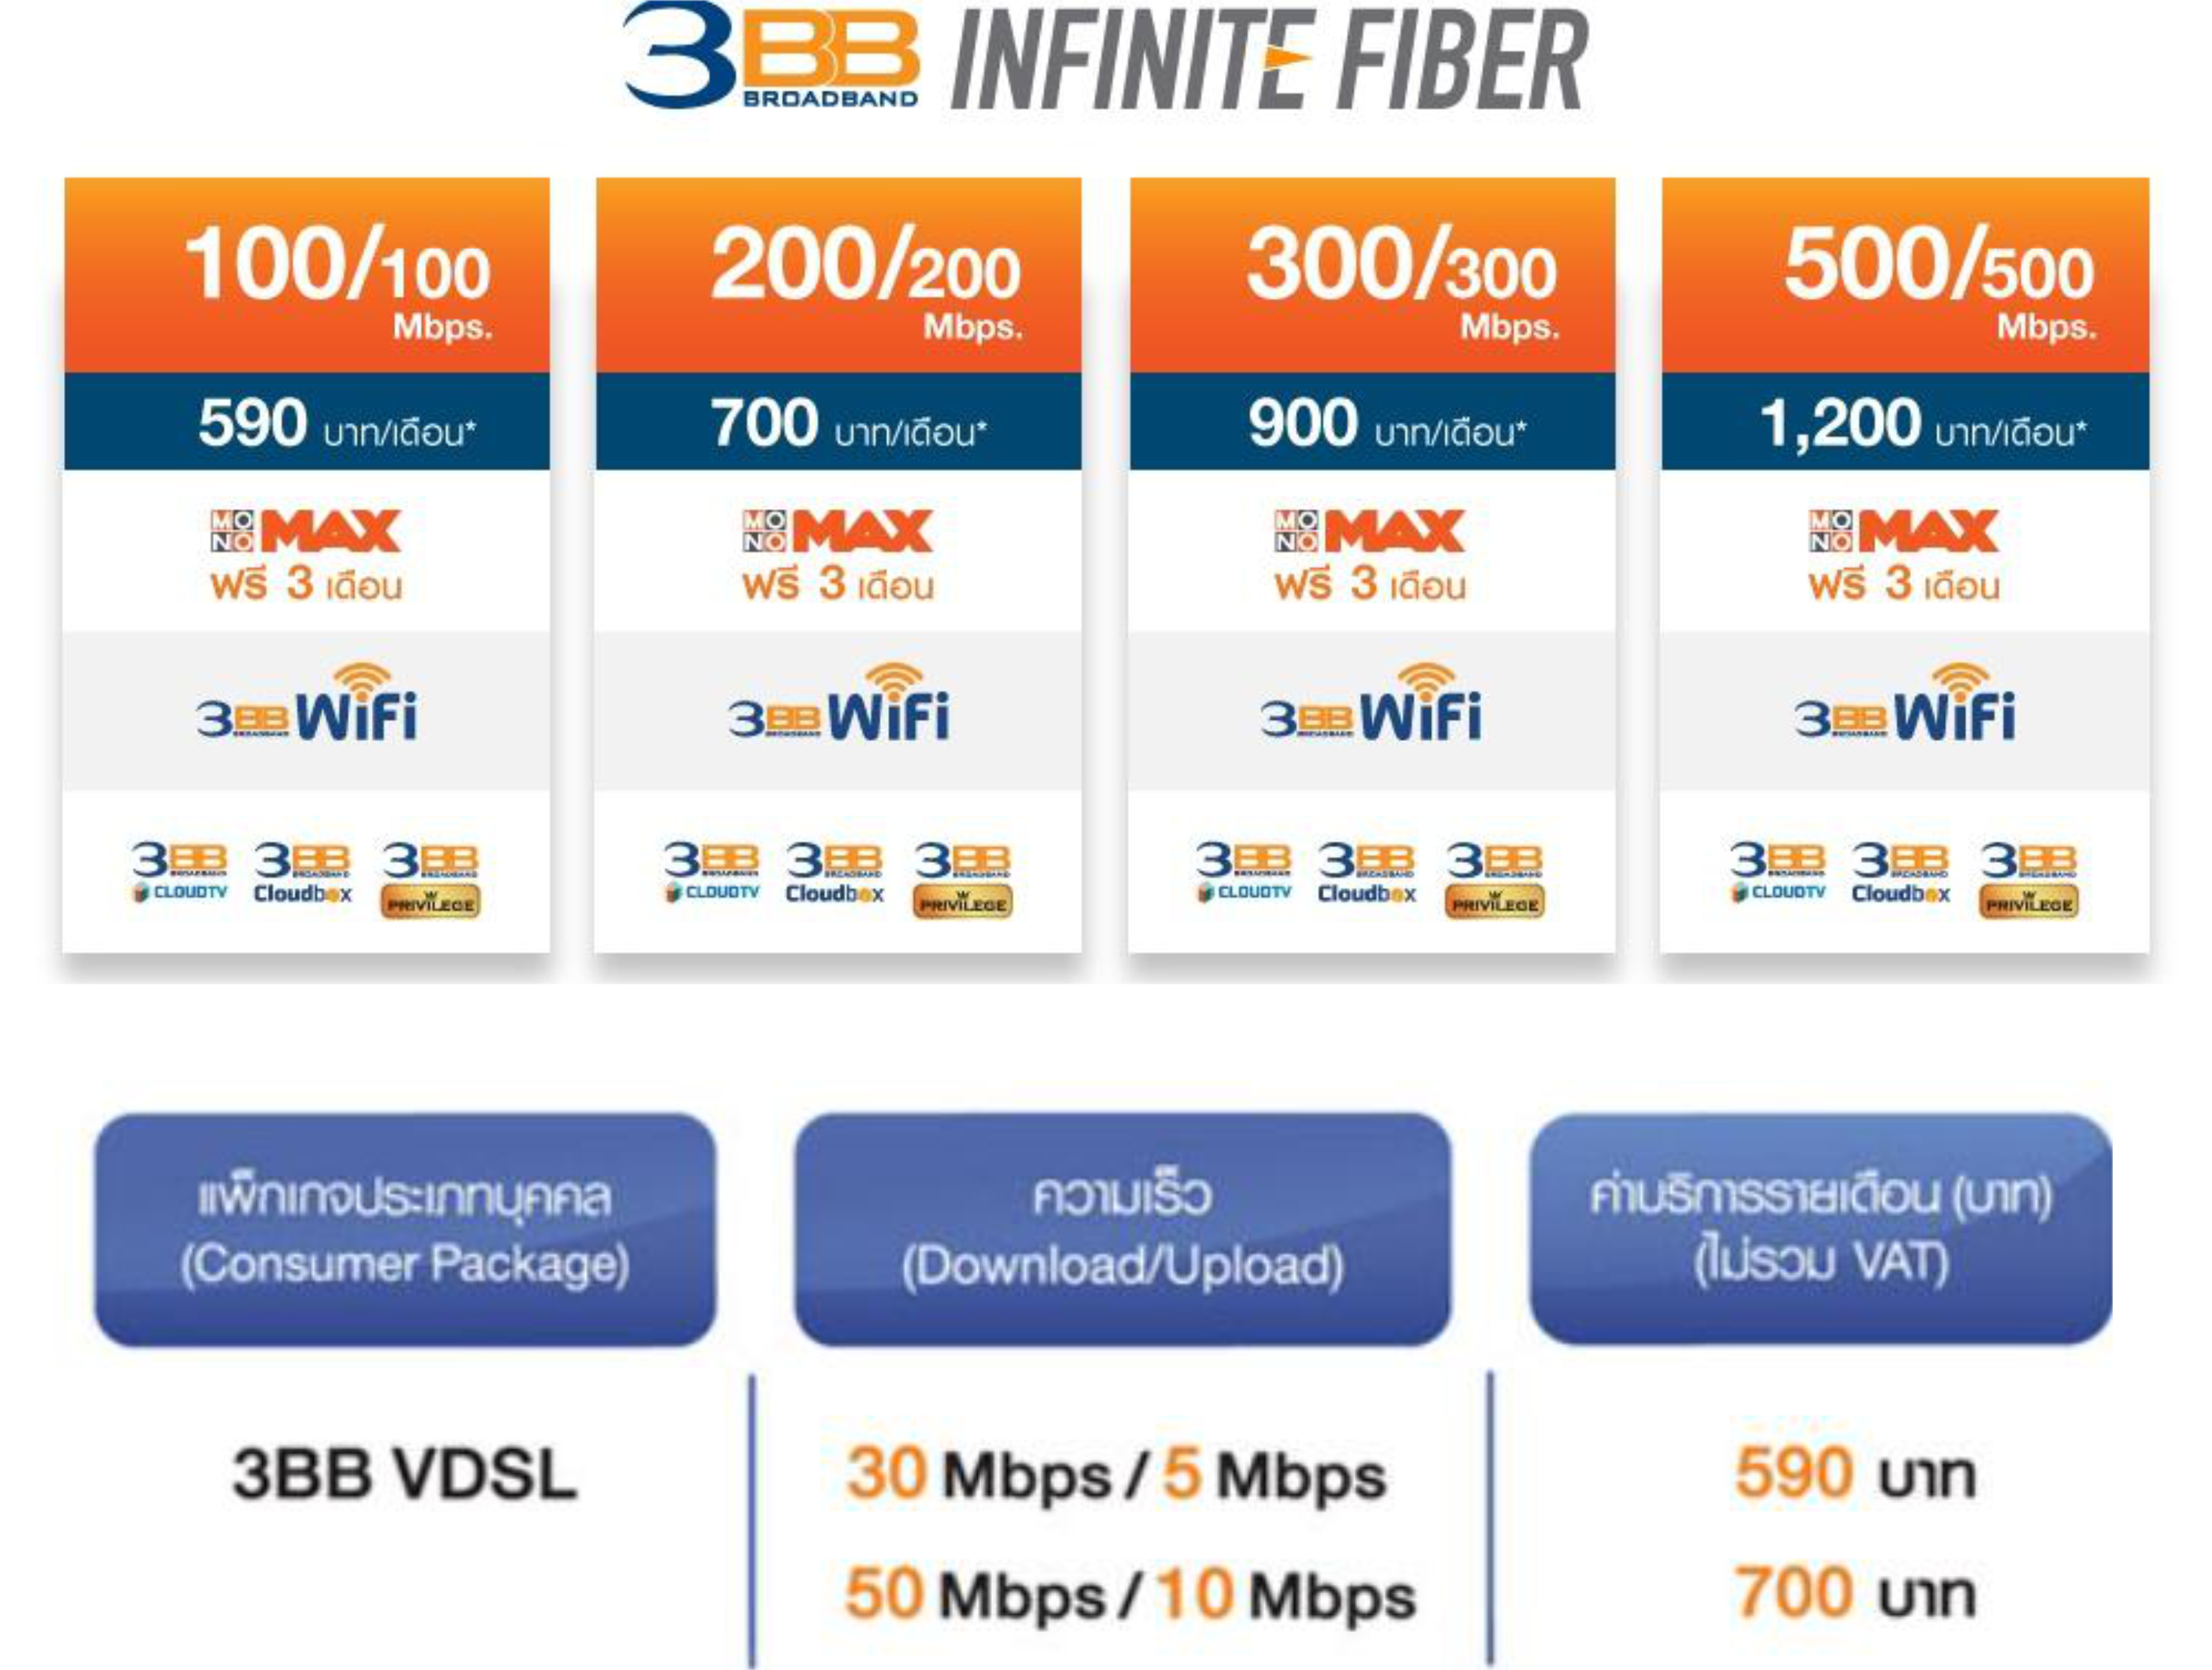
อย่าลืมไปทวนมาว่า VDSL, ADSL คืออะไร ต่างกันยังไงนะ
Note: Package shows symmetrical upload/download speeds
Speed Test Example
image: Windows Ethernet 5 Status showing 1.0 Gbps connection speed
image: Speedtest.net result showing Download: 738.39 Mbps, Upload: 356.75 Mbps, Ping: 4 ms
Connection: Gigabit Lan Connection (My Laptop)
Test Server: 3BB Bangkok
Note: Internet speed (738 Mbps) is less than connection speed (1 Gbps) due to ISP package limits
Equipment Compatibility
Image: Network diagram showing Internet Subscription D500Mb/U200Mb with various equipment: Lan 100Mb, Lan 1Gb, Wi-Fi (b,g,n,ac) connections, showing bottlenecks
Important Points:
- Make sure to not mismatch the equipment
- Most of network equipment are backward compatibility (It may work but not at max efficient)
Connection Speeds:
- Lan: 100Mb - Bottleneck
- Lan: 1Gb - Full speed
- Wi-Fi: g (52Mb) - Limited
- Wi-Fi: ac (750Mb) - Full speed capability
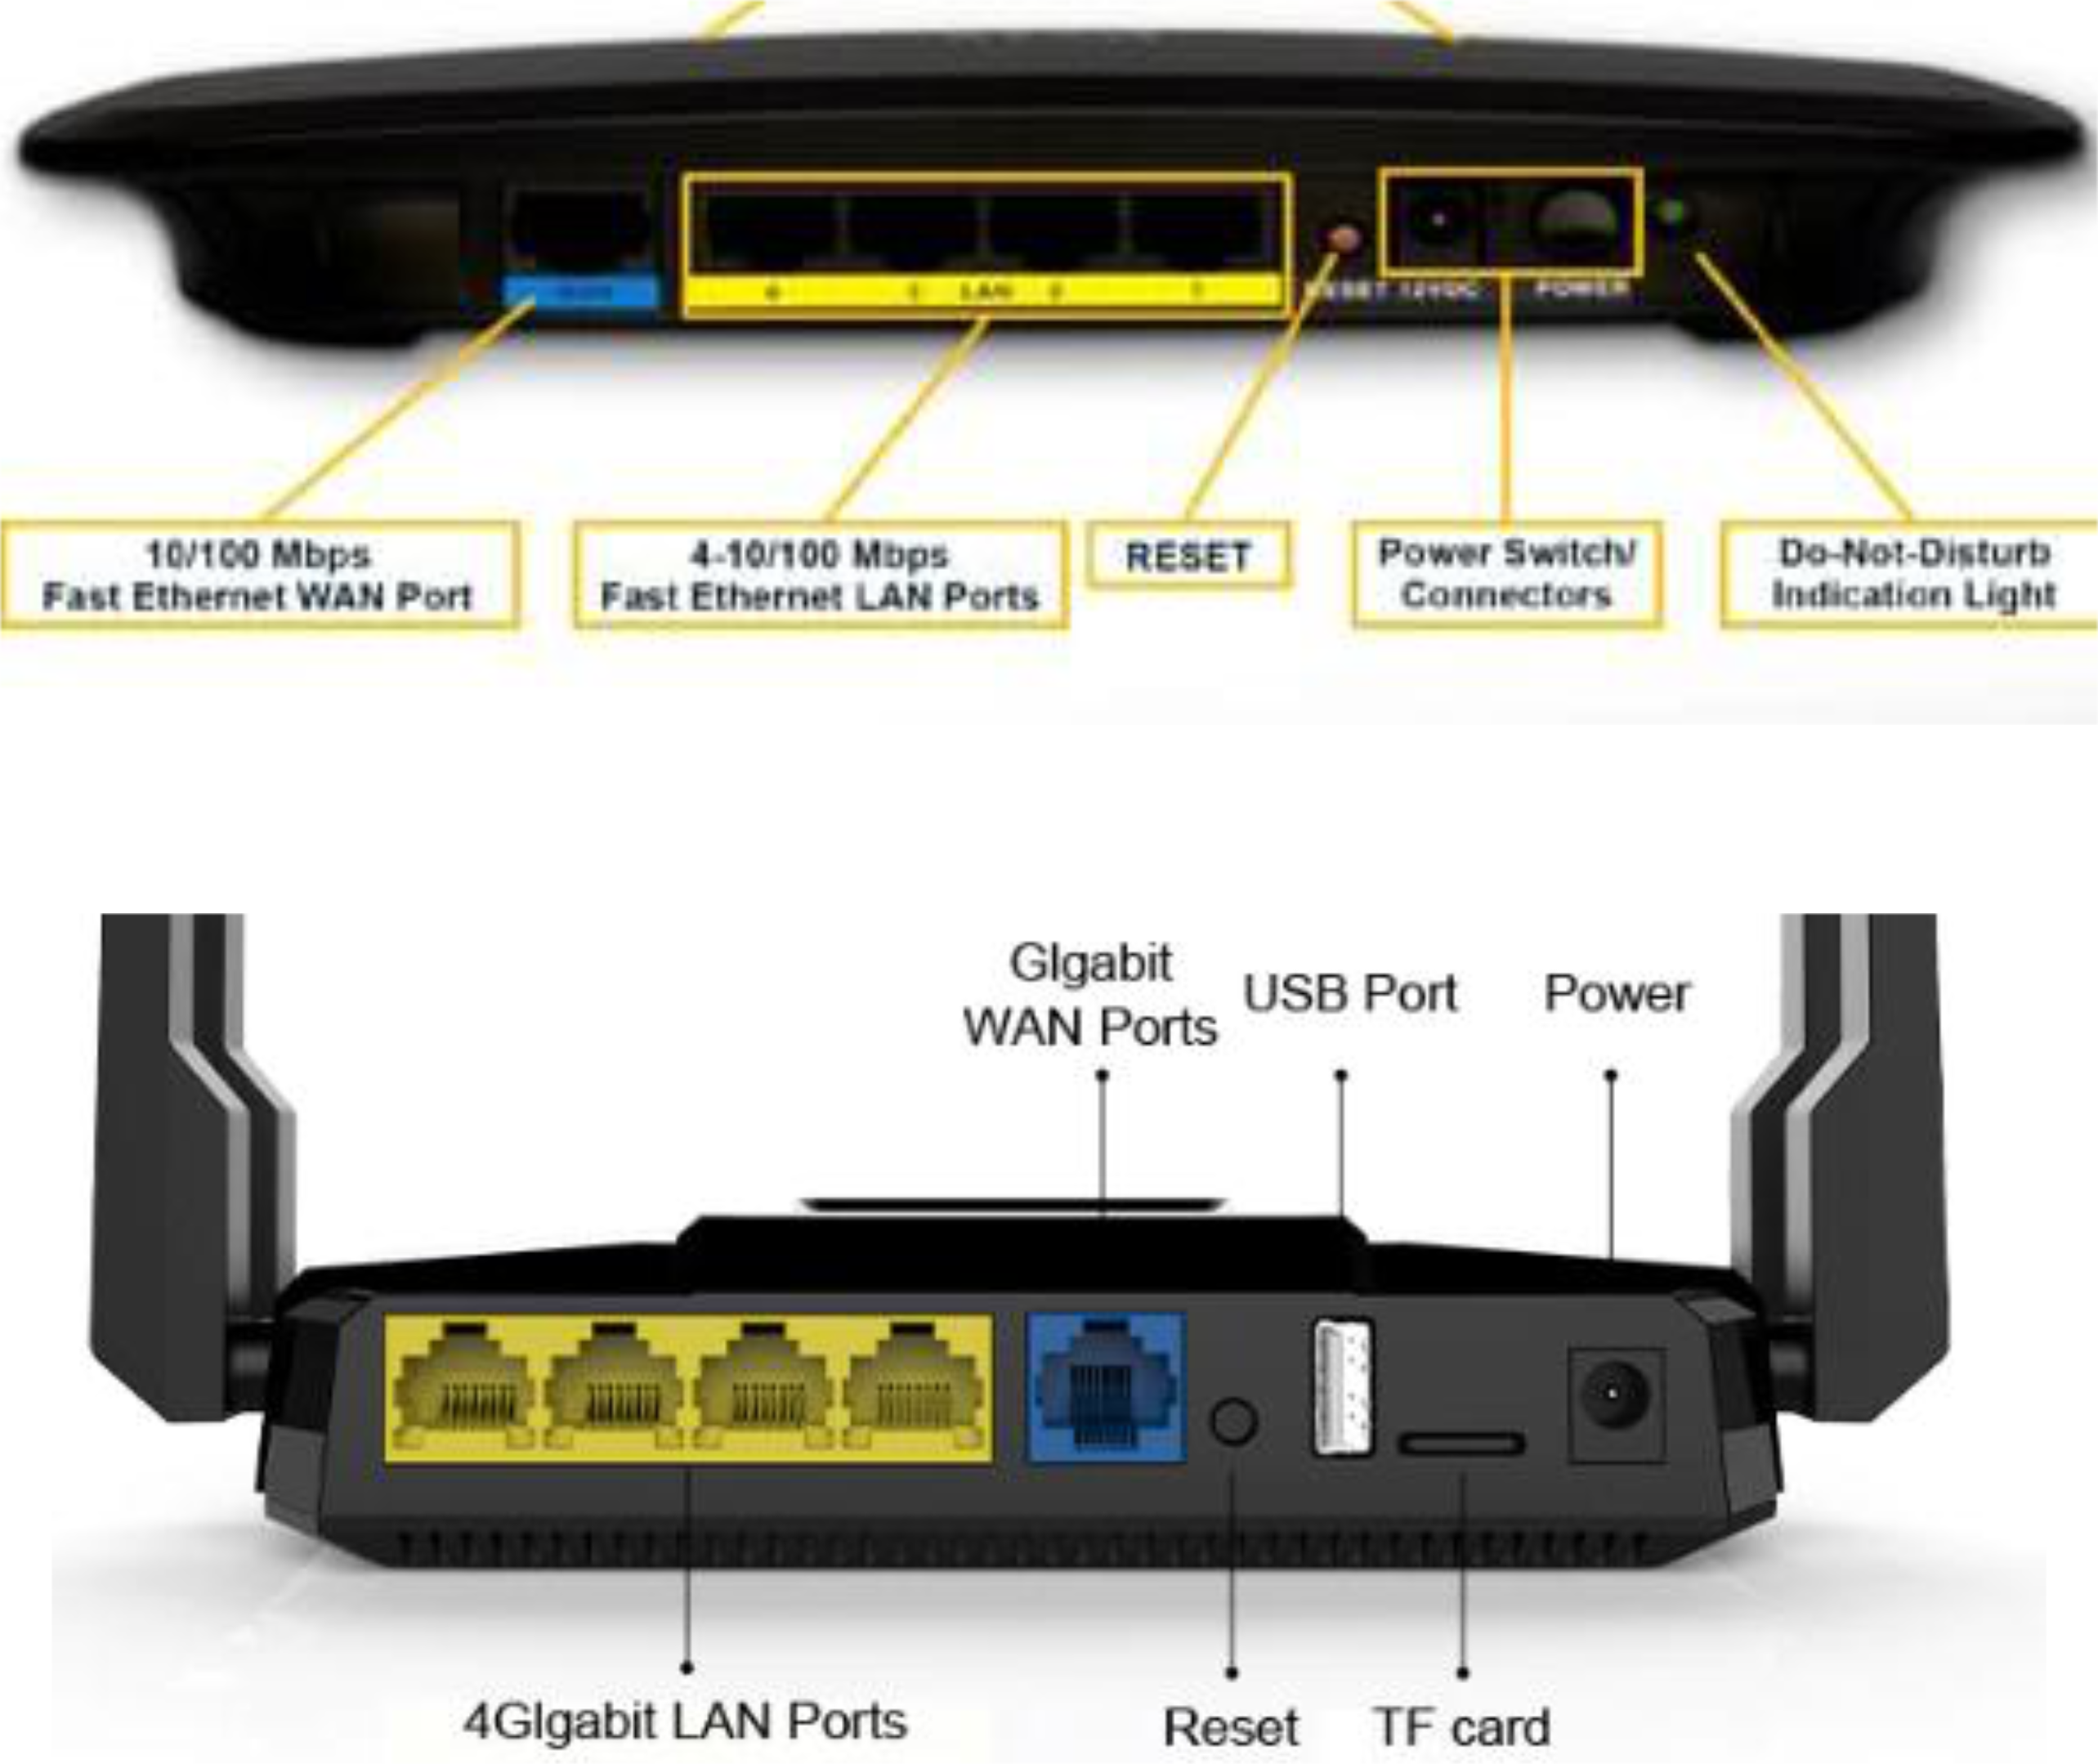
Router Port Types
image: Router showing 10/100 Mbps Fast Ethernet WAN Port, 4-10/100 Mbps Fast Ethernet LAN Ports, RESET, Power Switch, Do-Not-Disturb Indication Light
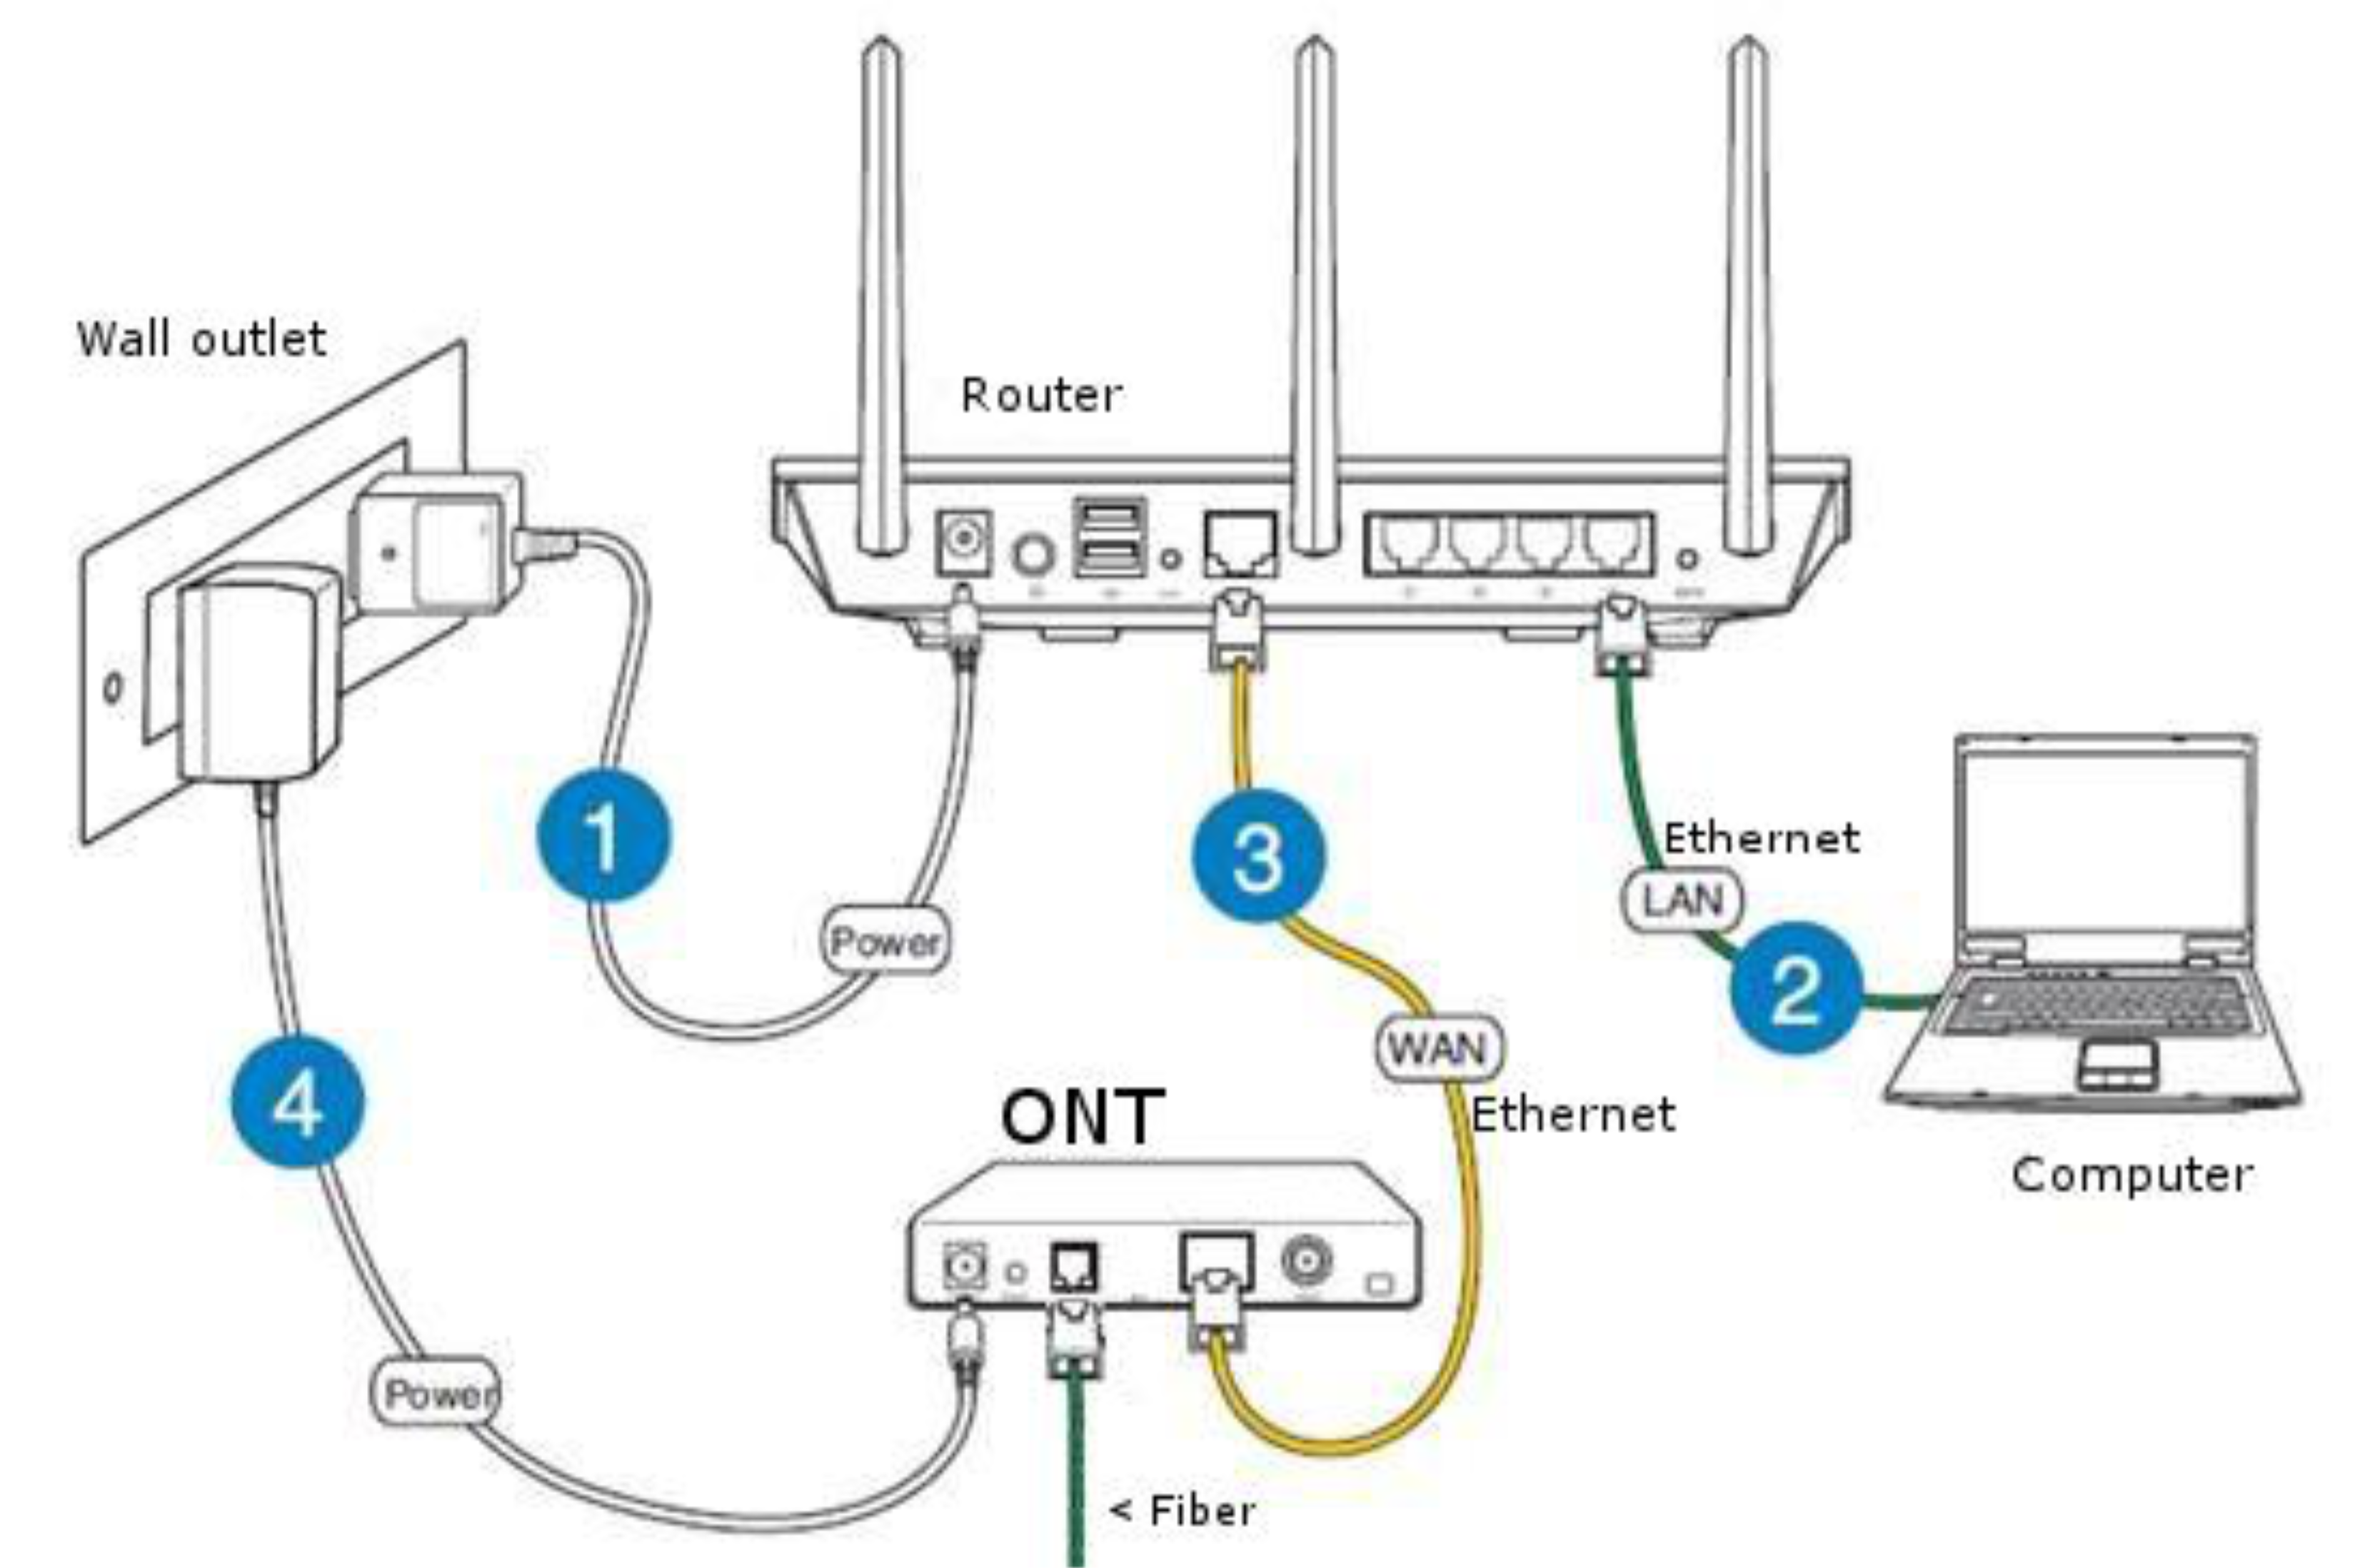
image: Router back showing Gigabit WAN Ports, USB Port, Power, 4 Gigabit LAN Ports, Reset, TF card
Key Difference:
- Fast Ethernet: 10/100 Mbps
- Gigabit: 1000 Mbps (1 Gbps)
Analogy: Having a 1 Gbps internet package but using a 100 Mbps router is like buying a sports car but only driving it in a school zone. You're paying for speed you can't use!
Network Setup Example
image: Complex network diagram showing various connection types and speeds from Internet (D500Mb/U200Mb) through different devices with Lan 1Gb, Lan 100Mb, Wi-Fi ac (750Mb), Wi-Fi g (52Mb) connections
Bottlenecks identified:
- Any 100 Mbps link limits speed to 100 Mbps
- Wi-Fi g limits to 52 Mbps
- Even with 500 Mbps internet, you can only get the speed of your slowest link
Network Speed Bottleneck
Packet Delay and Loss
Packets queue in router buffers, waiting for turn for transmission:
- Queue length grows when arrival rate to link (temporarily) exceeds output link capacity
- Packet loss occurs when memory to hold queued packets fills up
Image: Diagram showing packet being transmitted (transmission delay), packets in buffers (queueing delay), and free buffers where arriving packets are dropped (loss)
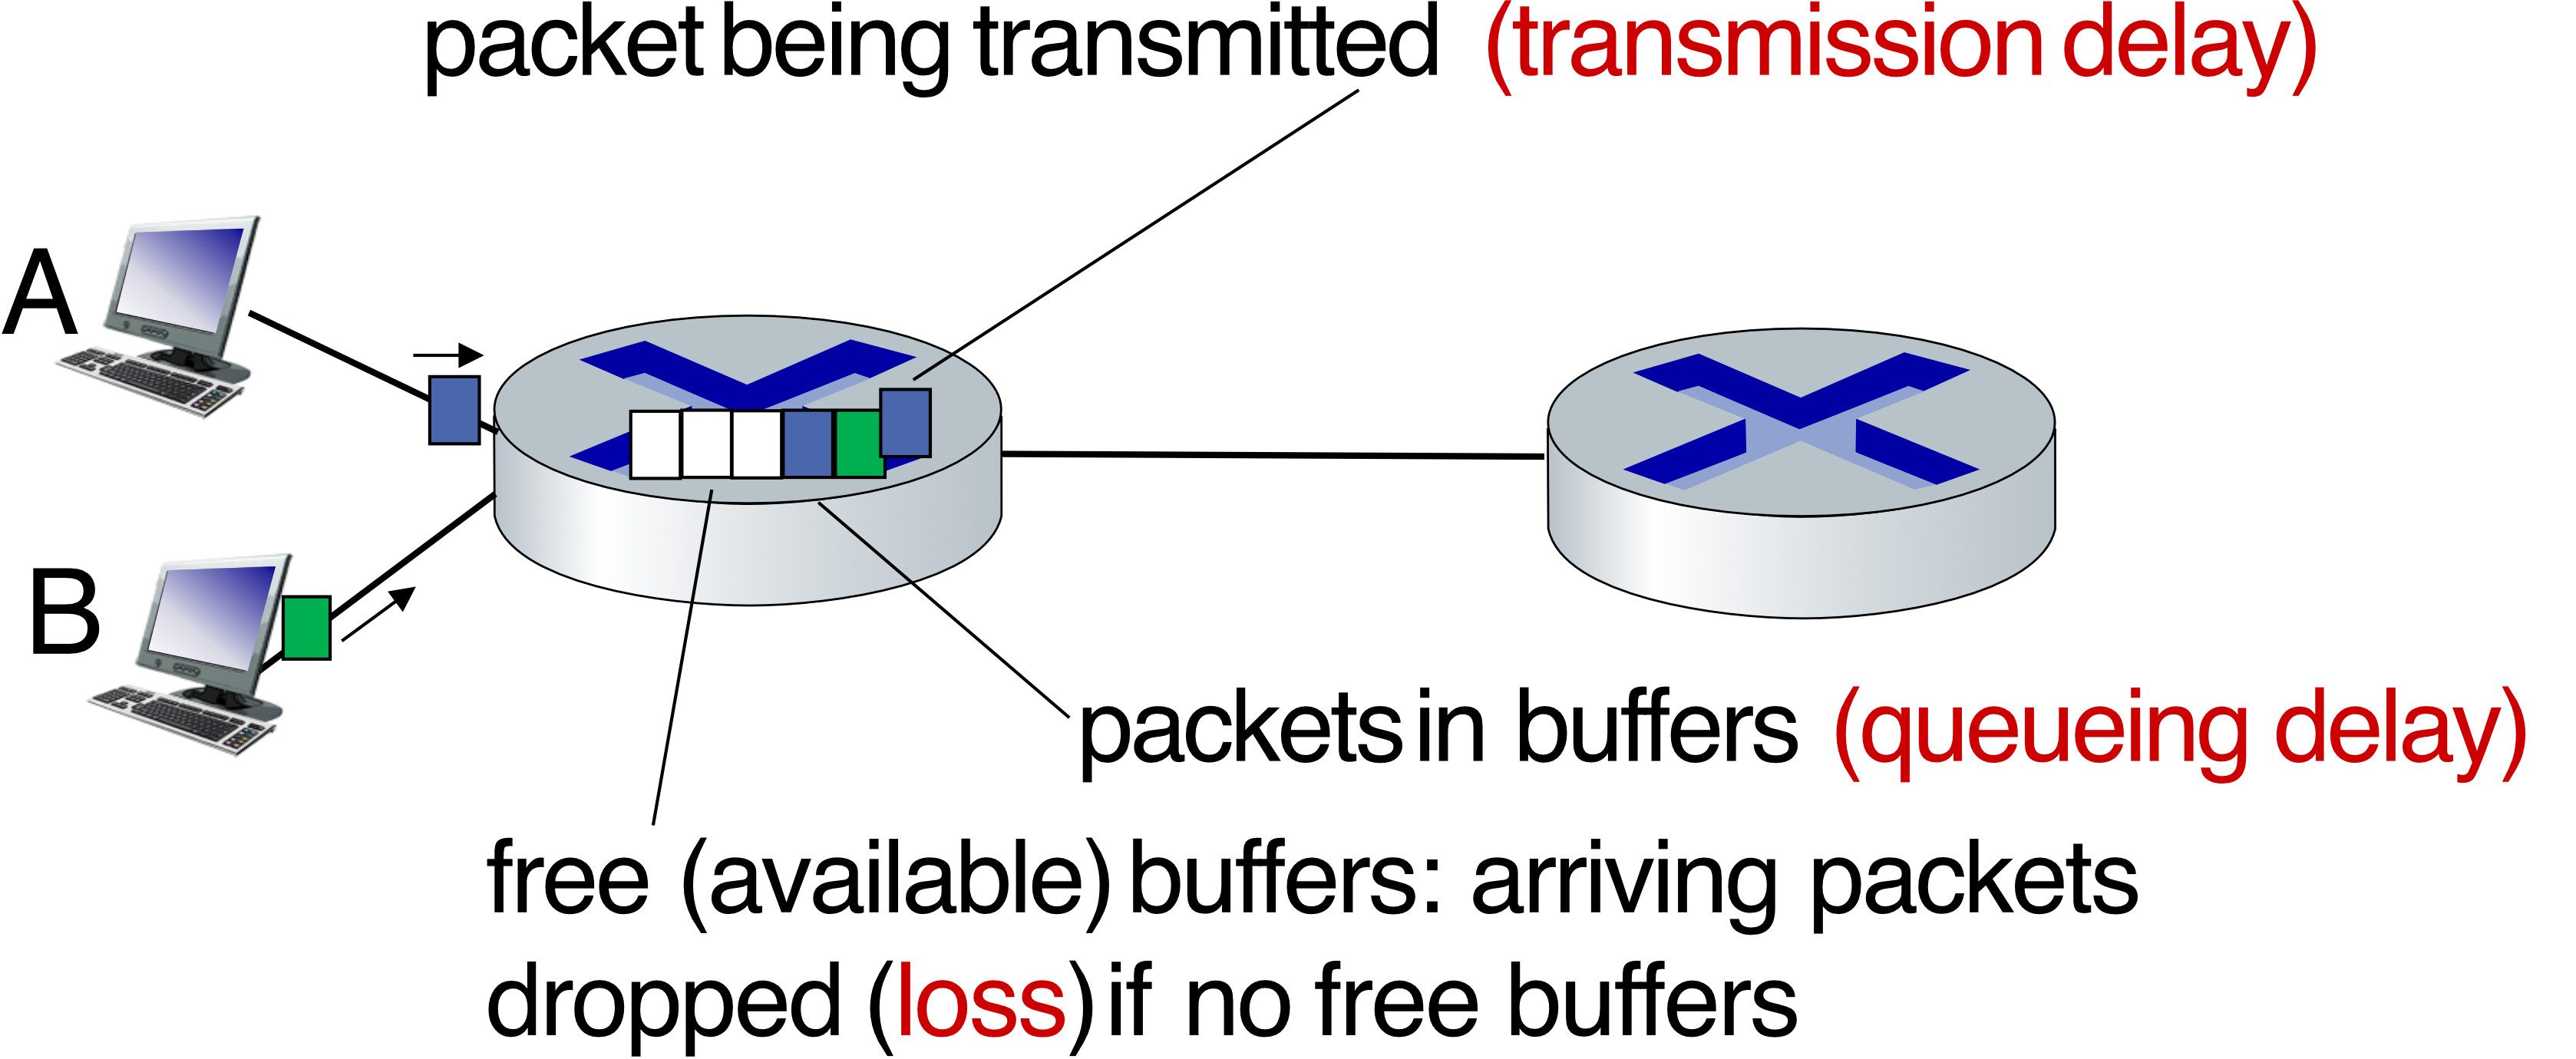
เห็นป้ะว่าใน Switching มันมี Buffer เหมือนจะอยู่ 6 กล่อง คือถ้าบางครั้งไม่มีที่ว่างเหลือแล้ว ไอ่ตัวที่เข้ามาใหม่ router ก็ drop ไปเลย ไม่ได้ส่งใหม่หรือว่าอะไรนะ นี่แหละเป็นในเหตุผลเวลาเราดู Netflix แล้วภาพแตก ภาพกระตุกได้!
Real Internet Delays and Routes
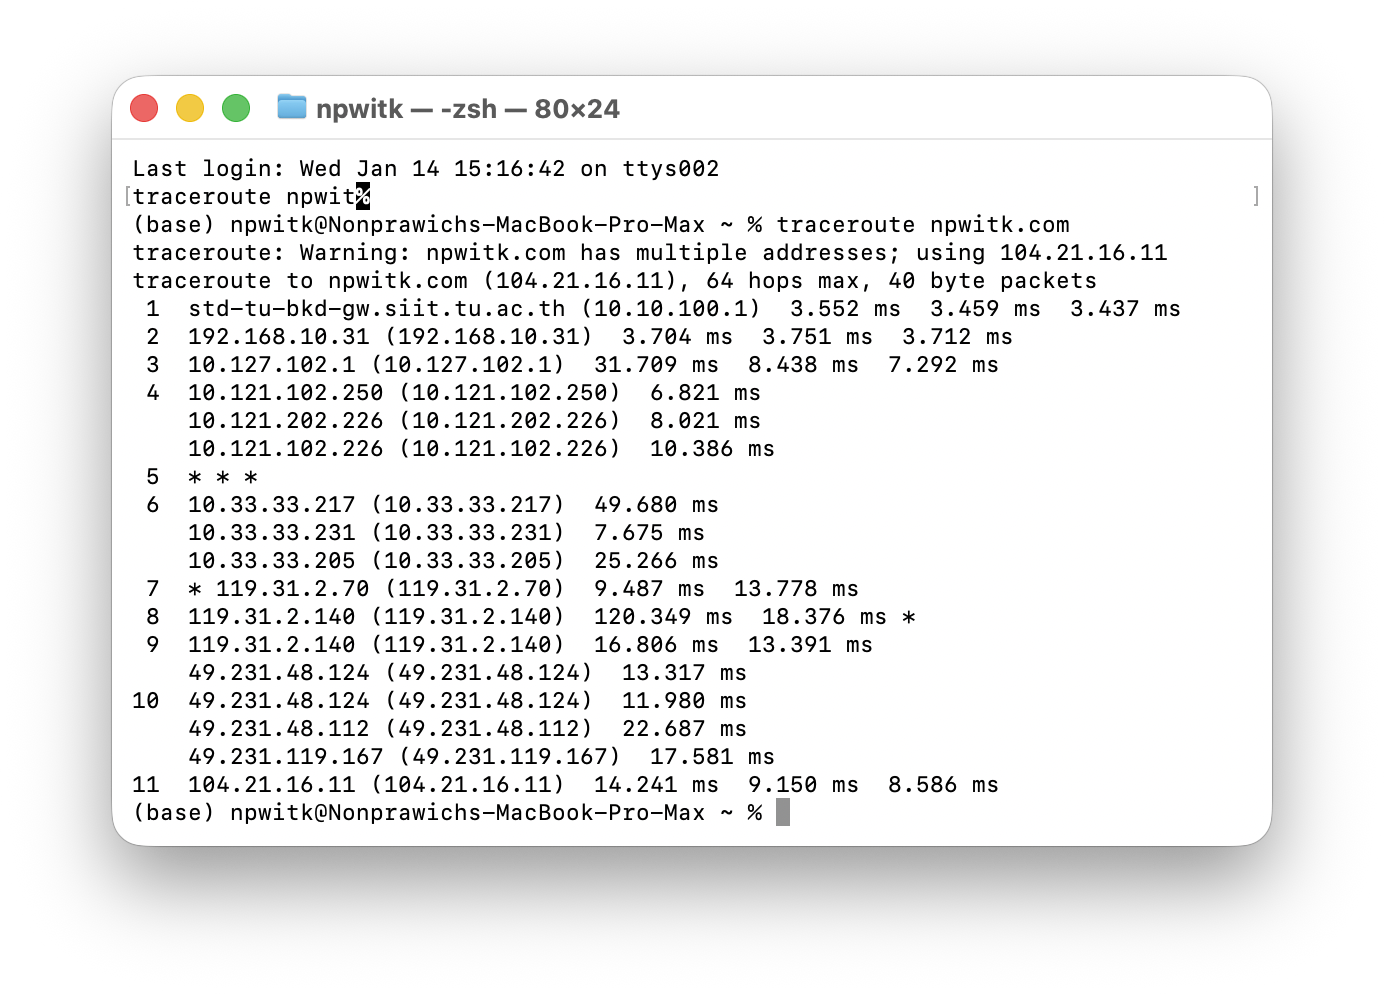
traceroute program provides delay measurement from source to router along end-end Internet path towards destination.
For all i:
- Sends three packets that will reach router i on path towards destination (with time-to-live TTL field value of i)
- Router i will return packets to sender
- Sender measures time interval between transmission and reply
คือเหมือนว่าแต่ละ packet จะมี TTL (default: 30 มั้ง) เวลาขยับไปแต่ละ hop เรื่อย ๆ แล้ว แต่ละ hop ลดTTL ทีละ 1 เมื่อเหลือ 0 แล้ว router จะ drop packet นั้นไปเลย (แล้วต้อง send message back to sender: ICMP)
Image: Diagram showing 3 probes being sent to each router along the path

Command: traceroute (Linux/Mac) or tracert (Windows)
tracerouteทำงานยังไงล่ะ? ถึงรู้ได้แต่ละ hop มันคืออะไร
ก็คือ Sender จะสร้าง TTL=1, TTL=2 ไรงี้อะ แล้วสุดท้ายมันก็จะ report back each hop ใช่มั้ยล่ะ
very cool!
Traceroute Example
traceroute: gaia.cs.umass.edu to www.eurecom.fr

1  cs-gw (128.119.240.254) 1 ms 1 ms 2 ms
2  border1-rt-fa5-1-0.gw.umass.edu (128.119.3.145) 1 ms 1 ms 2 ms
3  cht-vbns.gw.umass.edu (128.119.3.130) 6 ms 5 ms 5 ms
4  jn1-at1-0-0-19.wor.vbns.net (204.147.132.129) 16 ms 11 ms 13 ms
5  jn1-so7-0-0-0.wae.vbns.net (204.147.136.136) 21 ms 18 ms 18 ms
6  abilene-vbns.abilene.ucaid.edu (198.32.11.9) 22 ms 18 ms 22 ms
7  nycm-wash.abilene.ucaid.edu (198.32.8.46) 22 ms 22 ms 22 ms
8  62.40.103.253 (62.40.103.253) 104 ms 109 ms 106 ms         ← trans-oceanic link
9  de2-1.de1.de.geant.net (62.40.96.129) 109 ms 102 ms 104 ms
10 de.fr1.fr.geant.net (62.40.96.50) 113 ms 121 ms 114 ms
11 renater-gw.fr1.fr.geant.net (62.40.103.54) 112 ms 114 ms 112 ms
12 nio-n2.cssi.renater.fr (193.51.206.13) 111 ms 114 ms 116 ms
13 nice.cssi.renater.fr (195.220.98.102) 123 ms 125 ms 124 ms
14 r3t2-nice.cssi.renater.fr (195.220.98.110) 126 ms 126 ms 124 ms
15 eurecom-valbonne.r3t2.ft.net (193.48.50.54) 135 ms 128 ms 133 ms
16 194.214.211.25 (194.214.211.25) 126 ms 128 ms 126 ms
17 * * *                                         ← no response
18 * * *                                         ← no response
19 fantasia.eurecom.fr (193.55.113.142) 132 ms 128 ms 136 ms
Notes:
*means no response (probe lost, router not replying)- เขาอาจจะ config ไว้ ประมาณนั้น
- 3 delay measurements from each hop
- Trans-oceanic links show increased latency
Try it yourself: www.traceroute.org
Packet Loss
Queue (aka buffer) preceding link in buffer has finite capacity
Image: Diagram showing buffer (waiting area), packet being transmitted, and packet arriving to full buffer is lost
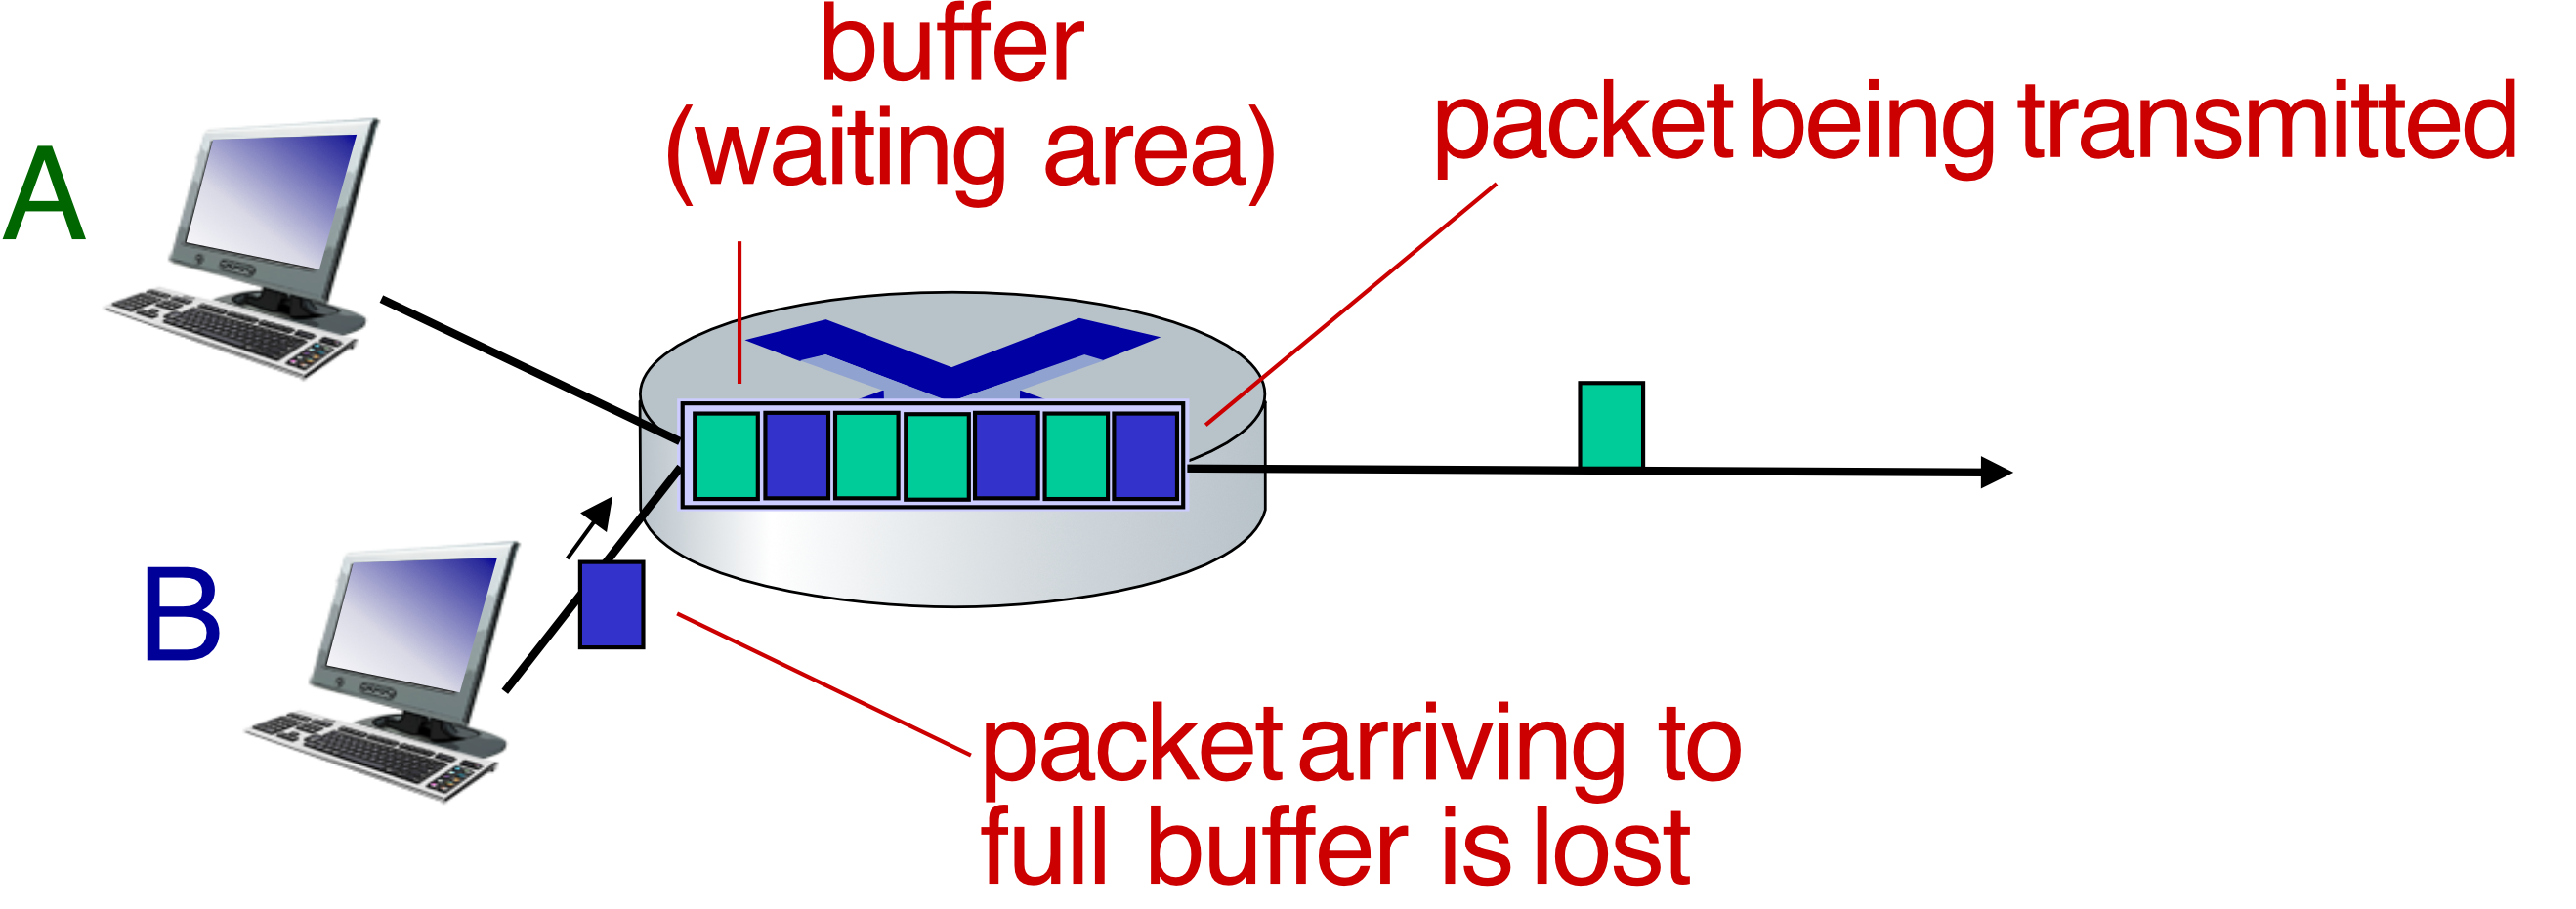
What happens:
- Packet arriving to full queue dropped (aka lost)
- Lost packet may be retransmitted by:
- Previous node
- Source end system
- Or not at all
Analogy: Think of a router's buffer like a waiting room. When the waiting room is full, new arrivals can't get in and are turned away (dropped).
Throughput
Definition
Throughput: rate (bits/time unit) at which bits are being sent from sender to receiver
- Instantaneous: rate at given point in time
- Average: rate over longer period of time
Image: Diagram showing server sending bits through pipes with capacities Rs bits/sec and Rc bits/sec
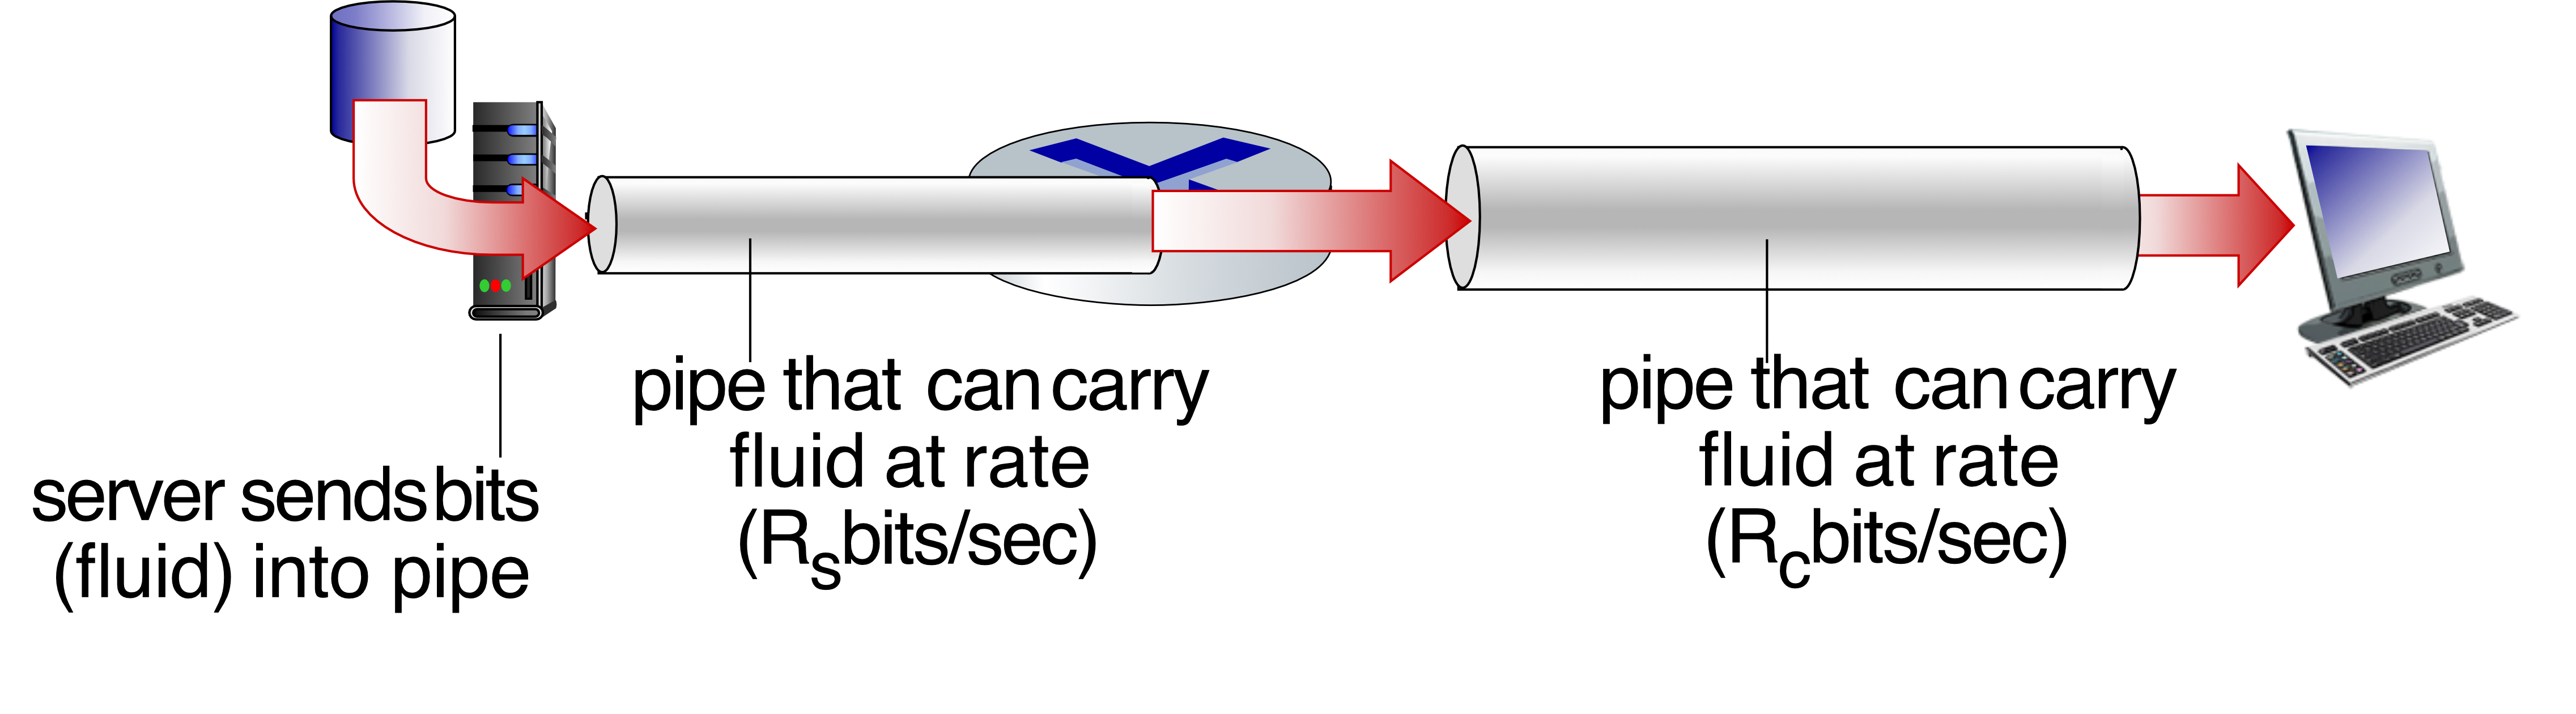
Analogy:
- Server sends bits (fluid) into pipe
- Pipe that can carry fluid at rate Rs bits/sec
- Another pipe that can carry fluid at rate Rc bits/sec
Throughput Calculation
Case 1: - What is average end-end throughput?
image: Rs bits/sec → Rc bits/sec
Answer: (limited by sender)
Case 2: - What is average end-end throughput?
image: Rs bits/sec → Rc bits/sec
Answer: (limited by receiver)
Bottleneck Link
Bottleneck link: Link on end-end path that constrains end-end throughput
Analogy: Throughput is like water flowing through connected pipes. The narrowest pipe determines the total flow, no matter how wide the other pipes are.
Network Scenario
Image: Network with 10 connections sharing backbone with Rs, Rc, and R (backbone) links
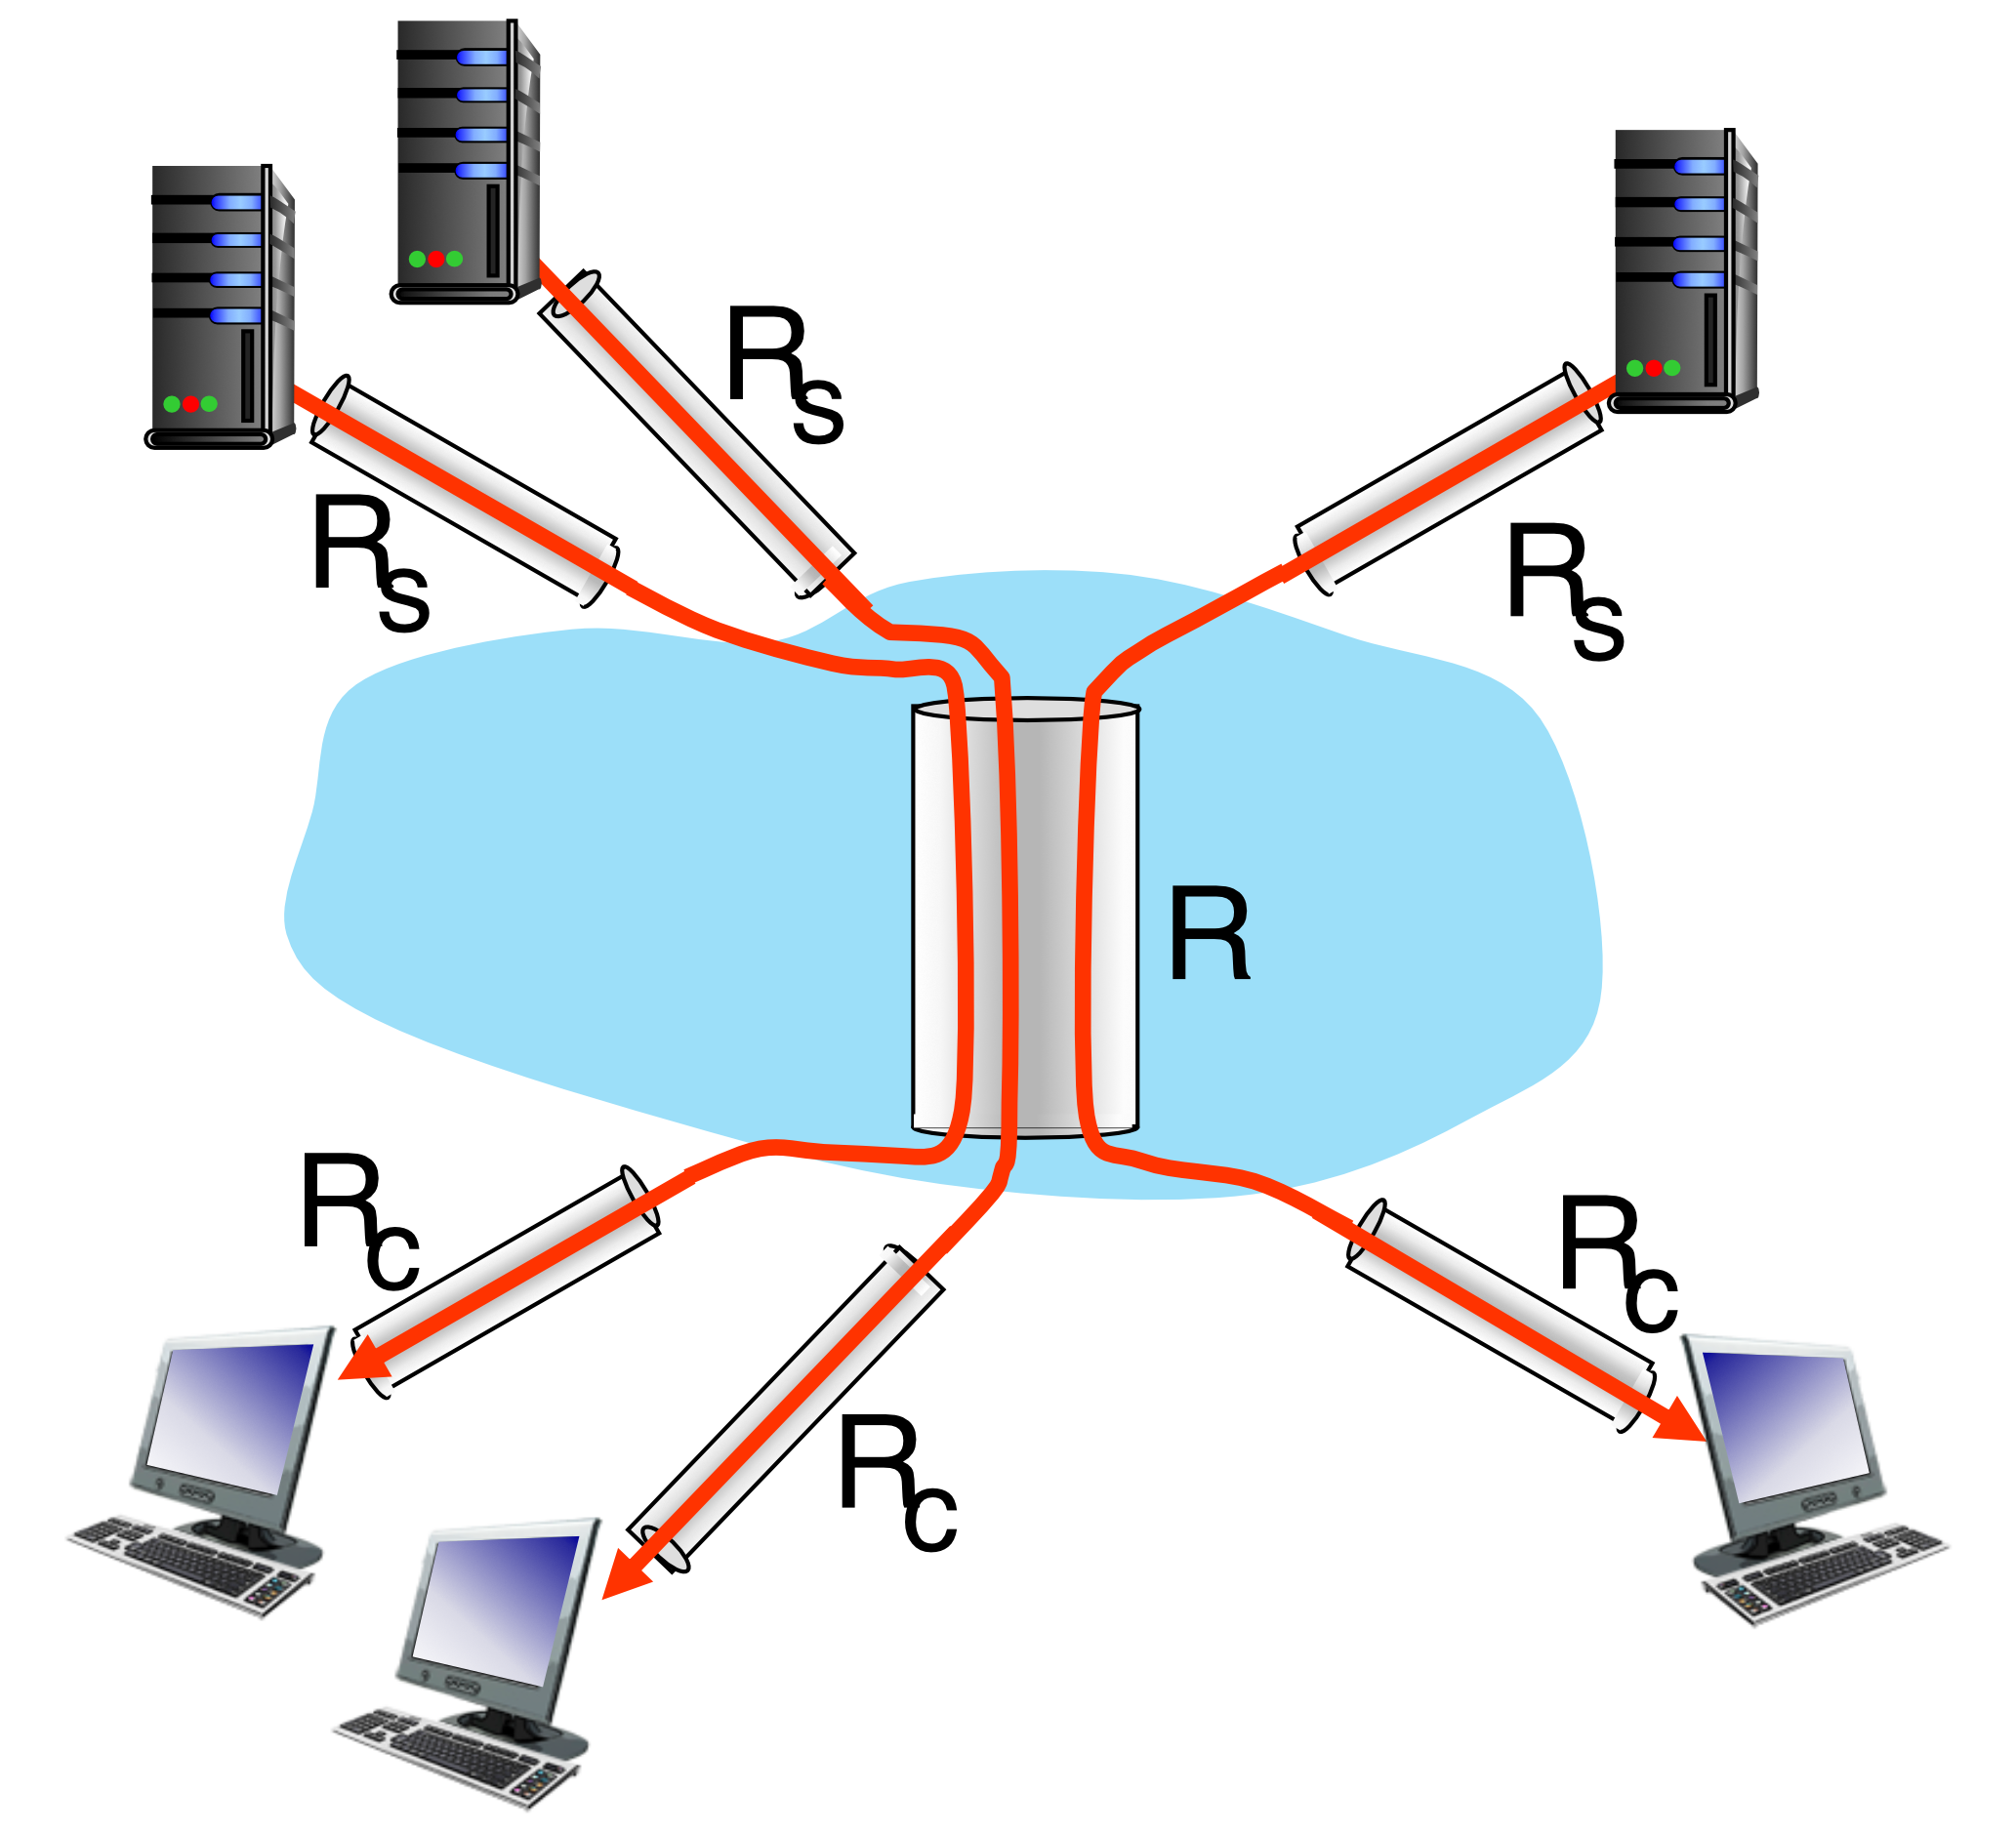
Scenario:
- 10 connections (fairly) share backbone bottleneck link R bits/sec
Per-connection end-end throughput:
In practice: or is often bottleneck
Note: Even if the backbone is fast, each connection only gets 1/10th of the backbone capacity when shared fairly.
Summary
Key Concepts Covered
Access Network
- DSL, Cable, Fiber, Satellite, Data Center
Internet Service Provider (ISP)
- Services, Hosting, Mail, Internet Access
Internet Structure
- Tier-1, Tier-2, Tier-3
- IXP and Peering
Internet Speed vs Connection Speed
- Subscription, Equipment Compatibility
- Backward compatibility issues
Network Speed Bottleneck
- Internet delays and routes
- Packet loss and queueing
- Throughput limitations
To be continued...
image: Dutch windmills
Key Takeaways
-
The Internet is a "network of networks" with hierarchical structure (Tier 1, 2, 3 ISPs)
-
Access technologies vary in speed, reliability, and use cases:
- DSL uses phone lines (24-52 Mbps down)
- Cable shares bandwidth (40 Mbps - 1.2 Gbps)
- Fiber offers highest speed (10-100s Gbps)
- Satellite serves remote areas (variable latency)
-
Connection speed ≠ Internet speed
- Your effective speed is limited by the slowest link
- Equipment compatibility is crucial
- Bottlenecks can occur at any point
-
Network performance depends on:
- Throughput:
- Delay: queueing, transmission, propagation
- Packet loss: buffer overflow
-
ISP Tiers:
- Tier-1: Global backbone (settlement-free peering)
- Tier-2: National/regional (buys from Tier-1)
- Tier-3: Local (buys from Tier-2)