- Class 9 (หยุด)
- Class 10 - บอกคะแนน Midterm + สอนนิดหน่อย
- Class 11 - March 17
- March 17+7 หยุด อาจารย์ทำฟัน
Financial Statements Are Designed for Analysis
- Classified Financial Statements
- Items with certain characteristics are grouped together
- Results in standardized, meaningful subtotals
- Comparative Financial Statements
- Amounts from several years appear side by side
- Helps identify significant changes and trends
- Consolidated Financial Statements
- Information for the parent and subsidiary are presented
- Presented as if the two companies are a single business unit
Tools of Analysis
Four main tools used to analyze financial statements:
- Dollar & Percentage Changes — How much did a line item change?
- Trend Percentages — What is the multi-year direction?
- Component Percentages — What proportion is each item relative to the whole?
- Ratios — What is the relationship between two financial items?
1. Dollar and Percentage Changes
Dollar Change
Percentage Change
Analogy: If your salary was ฿20,000 last year and ฿25,000 this year, the dollar change is +฿5,000, and the % change is 25%. Simple before-and-after comparison.
Example — Clover, Inc. Comparative Balance Sheets (Dec 31)
| Item | 2025 | 2024 | Dollar Change | % Change |
|---|---|---|---|---|
| Cash & equivalents | $12,000 | $23,500 | $(11,500) | -48.9% |
| Accounts receivable, net | 60,000 | 40,000 | 20,000 | +50.0% |
| Inventory | 80,000 | 100,000 | (20,000) | -20.0% |
| Prepaid expenses | 3,000 | 1,200 | 1,800 | +150.0% |
| Total current assets | $155,000 | $164,700 | (9,700) | -5.9% |
| Land | 40,000 | 40,000 | — | 0.0% |
| Buildings & equipment, net | 120,000 | 85,000 | 35,000 | +41.2% |
| Total property & equipment | $160,000 | $125,000 | 35,000 | +28.0% |
| Total assets | $315,000 | $289,700 | $25,300 | +8.7% |
Calculation example:
2. Trend Percentages
Used to reveal patterns in data covering successive periods.
Analogy: Set year 1 as "100%" (your baseline). Every subsequent year, you ask: "Compared to where I started, am I at 110%? 150%? 80%?" It's like tracking your fitness gains vs. your Day 1 benchmark.
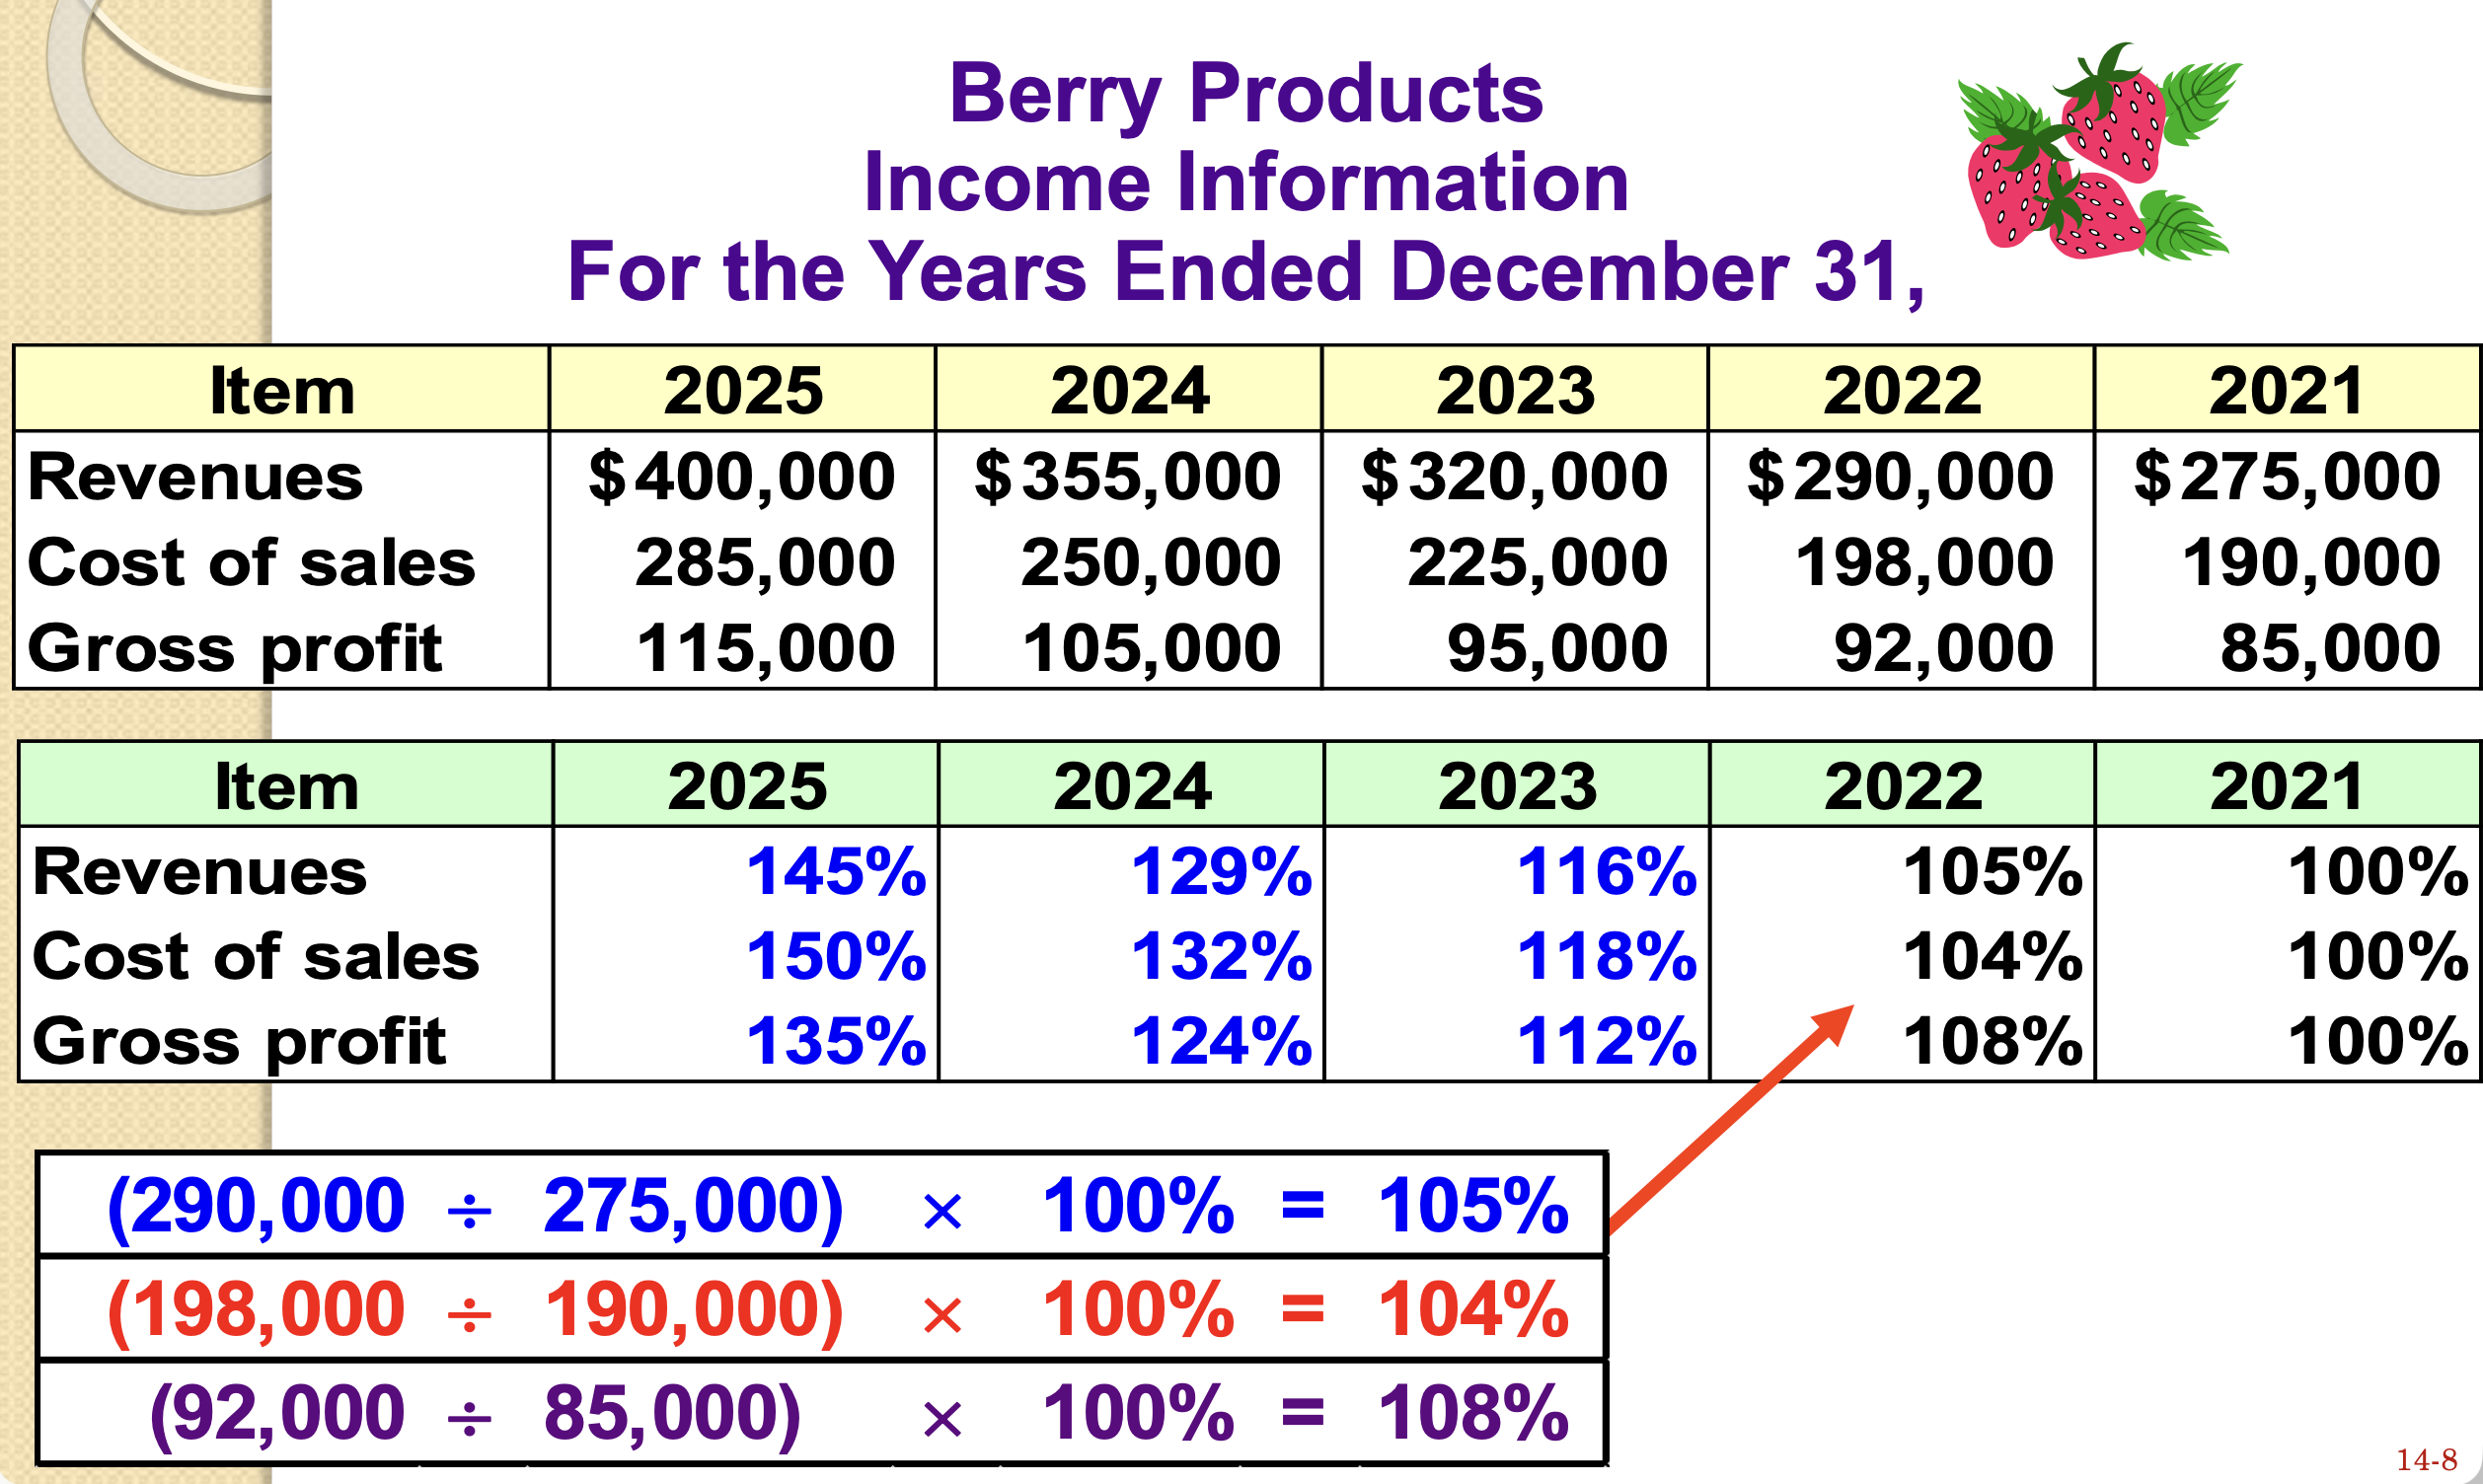
Example — Berry Products Income Information
| Item | 2025 | 2024 | 2023 | 2022 | 2021 (Base) |
|---|---|---|---|---|---|
| Revenues | $400,000 | $355,000 | $320,000 | $290,000 | $275,000 |
| Cost of sales | 285,000 | 250,000 | 225,000 | 198,000 | 190,000 |
| Gross profit | 115,000 | 105,000 | 95,000 | 92,000 | 85,000 |
| Trend Percentages (Base = 2021 = 100%) |
| Item | 2025 | 2024 | 2023 | 2022 | 2021 |
|---|---|---|---|---|---|
| Revenues | 145% | 129% | 116% | 105% | 100% |
| Cost of sales | 150% | 132% | 118% | 104% | 100% |
| Gross profit | 135% | 124% | 112% | 108% | 100% |
⚠️ Notice: Cost of sales grew faster (150%) than revenues (145%) — this signals a margin squeeze. Gross profit % growth (135%) lagging behind revenue growth is a warning sign!
3. Component Percentages (Common-Size Analysis)
Examines the relative size of each item as a % of a base amount.
| Financial Statement | Use X as Base Amount |
|---|---|
| Balance Sheet | Total Assets |
| Income Statement | Revenues (คือตัวที่เยอะที่สุด) |
Analogy: Imagine slicing a pizza. Each slice = one line item. Component % tells you _how big each slice is_compared to the whole pizza. Useful to compare companies of different sizes on equal footing.
Example — Clover, Inc. Balance Sheet (Common-Size)
| Item | 2025 | 2024 | % 2025 | % 2024 |
|---|---|---|---|---|
| Cash & equivalents | $12,000 | $23,500 | 3.8% | 8.1% |
| Accounts receivable, net | 60,000 | 40,000 | 19.0% | 13.8% |
| Inventory | 80,000 | 100,000 | 25.4% | 34.6% |
| Prepaid expenses | 3,000 | 1,200 | 1.0% | 0.4% |
| Total current assets | $155,000 | $164,700 | 49.2% | 56.9% |
| Land | 40,000 | 40,000 | 12.7% | 13.8% |
| Buildings & equipment, net | 120,000 | 85,000 | 38.1% | 29.3% |
| Total property & equipment | $160,000 | $125,000 | 50.8% | 43.1% |
| Total assets | $315,000 | $289,700 | 100.0% | 100.0% |
Example calculation: ($12,000 \div $315,000) \times 100\% = 3.8\%
Example — Clover, Inc. Income Statement (Common-Size)
| Item | 2025 | 2024 | % 2025 | % 2024 |
|---|---|---|---|---|
| Revenues | $520,000 | $480,000 | 100.0% | 100.0% |
| Cost of sales | 360,000 | 315,000 | 69.2% | 65.6% |
| Selling & admin. | 128,600 | 126,000 | 24.7% | 26.3% |
| Interest expense | 6,400 | 7,000 | 1.2% | 1.5% |
| Income before taxes | $25,000 | $32,000 | 4.8% | 6.7% |
| Income taxes (30%) | 7,500 | 9,600 | 1.4% | 2.0% |
| Net income | $17,500 | $22,400 | 3.4% | 4.7% |
| Net income per share | $0.79 | $1.01 | ||
| Avg. # common shares | 22,200 | 22,200 |
⚠️ Key insight: Cost of sales jumped from 65.6% → 69.2% of revenue, while net income margin shrank from 4.7% → 3.4%. The company is less profitable despite higher revenues.
4. Ratios
A ratio is a simple mathematical expression of the relationship between one item and another.
Ratios can compare:
- Past performance to present performance
- Other companies to your company
Uses & Limitations
| Uses | Limitations |
|---|---|
| Help users understand financial relationships | Management may manipulate transactions just to improve ratios |
| Provide quick comparison between companies | Don't capture progress toward non-financial goals |
All four methods are in #FinalExam
ให้คำนวณแบบ a
b, component per
c
d financial ratio analysis
A Classified Balance Sheet
- ไม่ลืมหรอกว่า Equation of Balance Sheet
- Assets = L + O
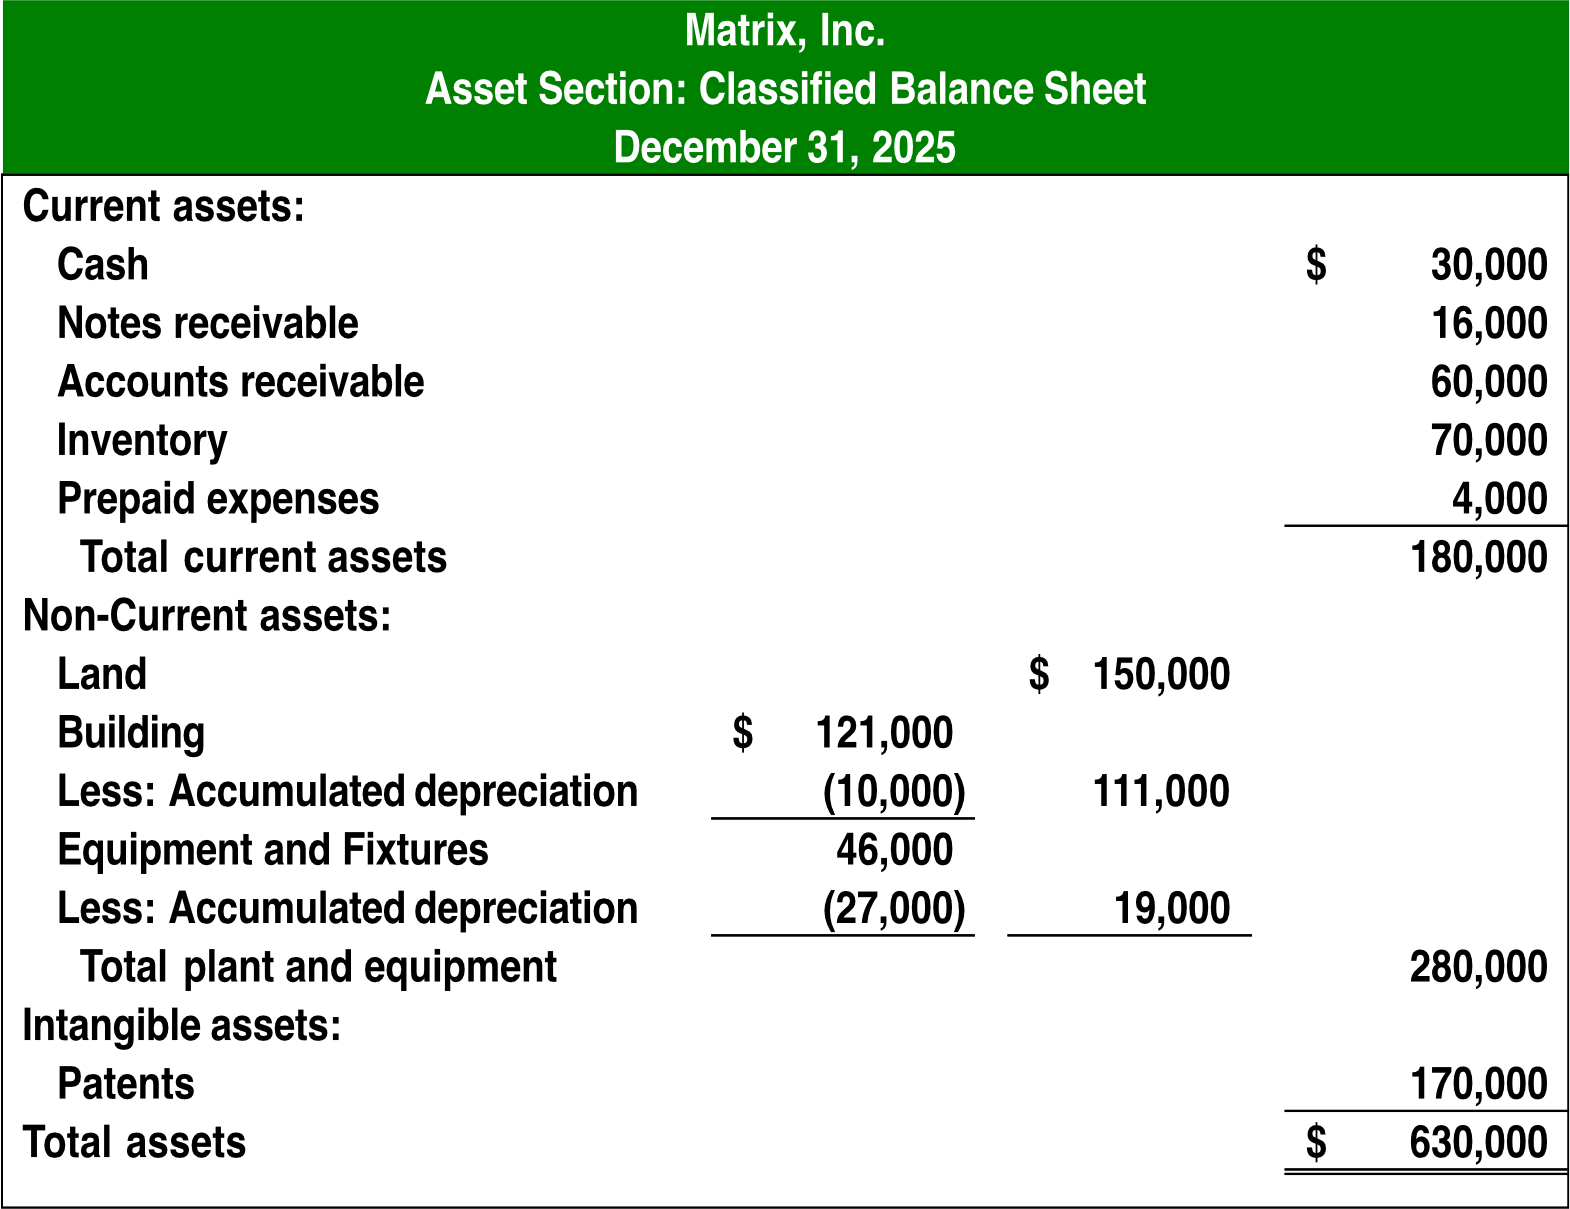
Asset Section — Matrix, Inc. (Dec 31, 2025)
Current Assets:
- Cash: $30,000
- Notes receivable: $16,000
- Accounts receivable: $60,000
- Inventory: $70,000
- Prepaid expenses: $4,000
- Total current assets: $180,000
Non-Current Assets (Plant & Equipment):
- Land: $150,000
- สำคัญมาก ว่าไม่ต้องคำนวณ Depreciation ถูกมะ
- Building 10,000) = $111,000
- Equipment & Fixtures 27,000) = $19,000
- Total plant & equipment: $280,000
Intangible Assets: (สินทรัพย์ที่จับต้องไม่ได้)
- Patents: $170,000
Total Assets: $630,000
Liability & Stockholders' Equity Section
Current Liabilities:
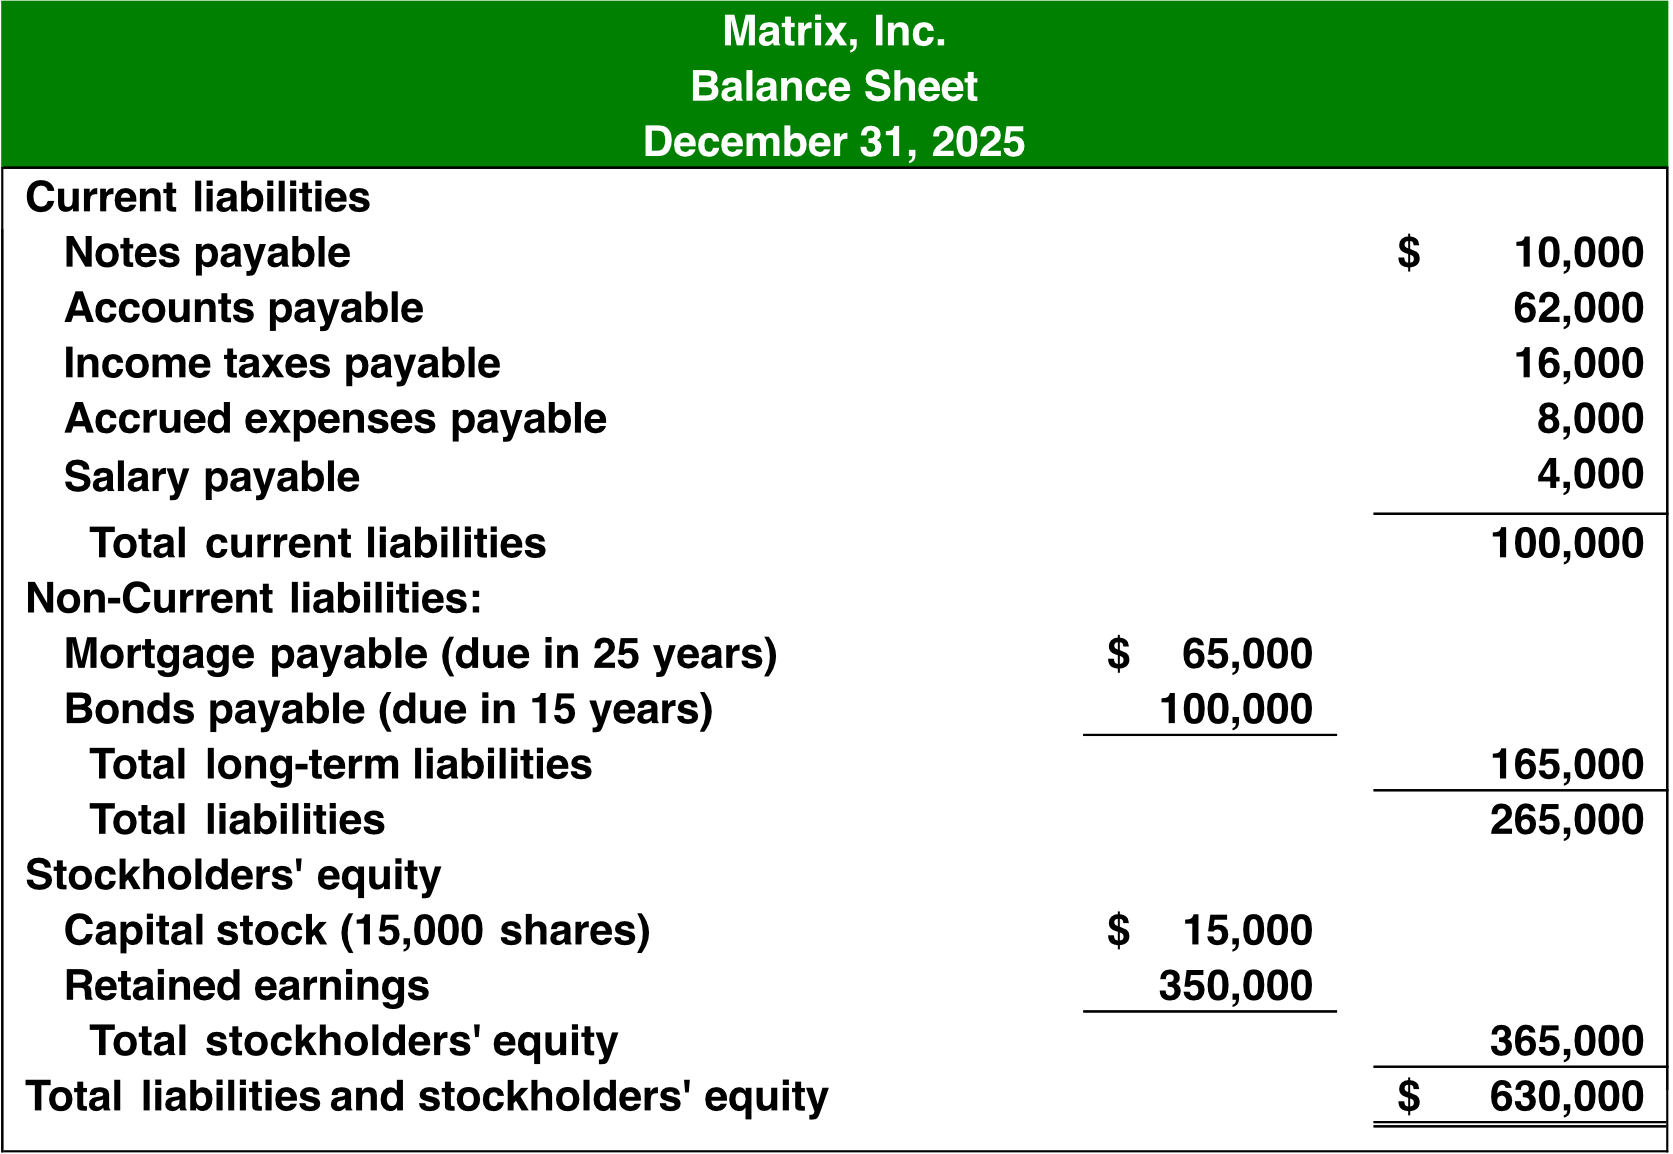
- Notes payable: $10,000
- Accounts payable: $62,000
- Income taxes payable: $16,000
- Accrued expenses payable: $8,000
- **Total current liabilities: 4,000 as a typo — actual sum is $96,000)_
Non-Current Liabilities:
- Mortgage payable (due 25 years): $65,000
- Bonds payable (due 15 years): $100,000
- Total long-term liabilities: $165,000
- Total liabilities: $265,000
Stockholders' Equity:
- Capital stock (15,000 shares): $15,000
- Retained earnings: $350,000 (กำไรสะสม)
- Total stockholders' equity: $365,000
Total Liabilities & Stockholders' Equity: $630,000
Liquidity Ratios
- Ability to pay short term liability/debt
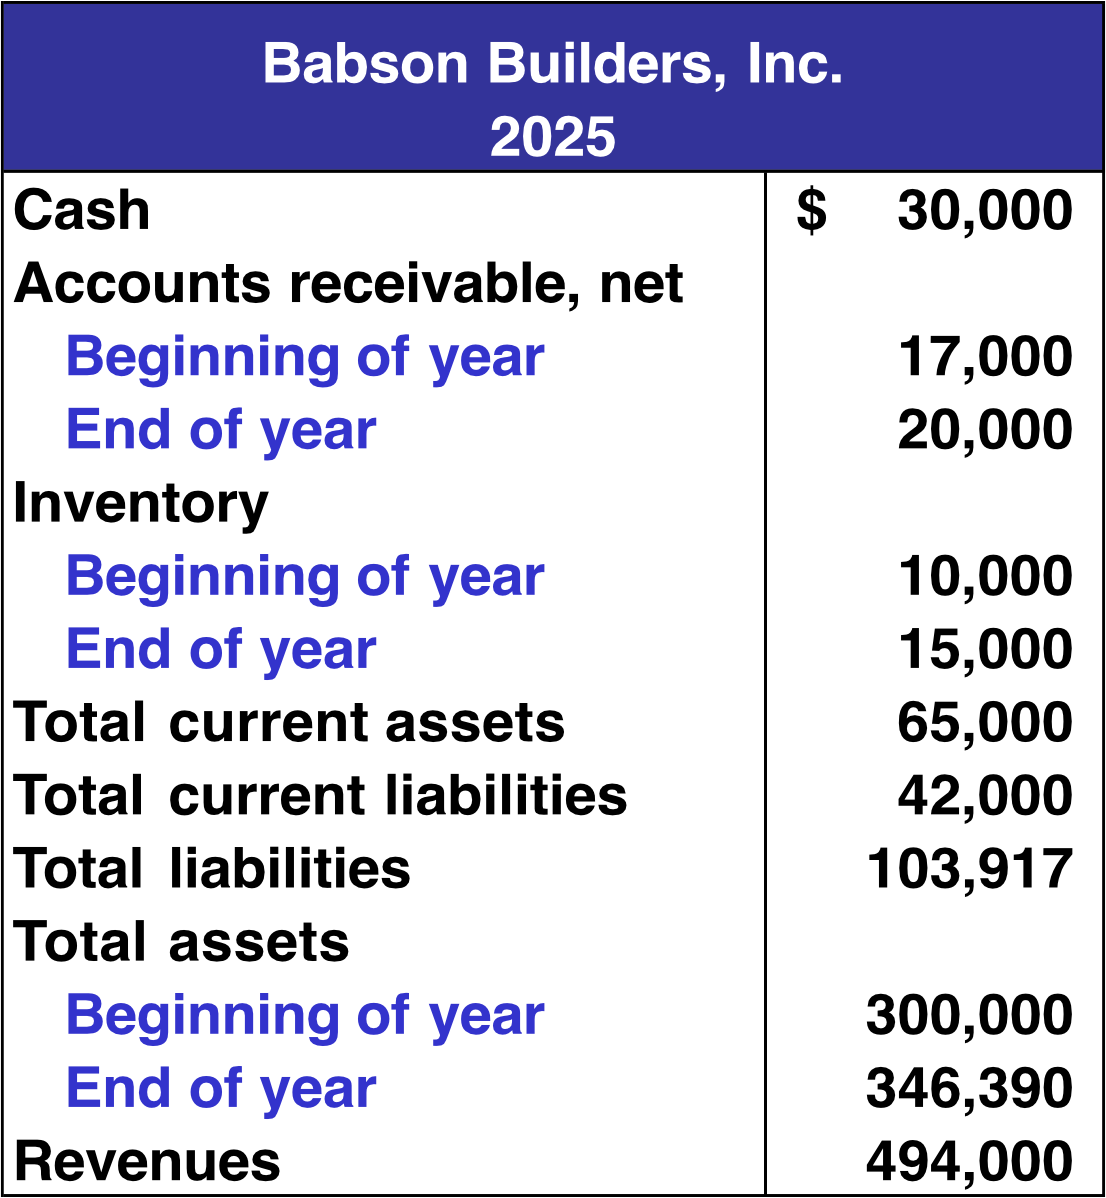
Data used: Babson Builders, Inc. 2025
| Item | Value |
|---|---|
| Cash | $30,000 |
| Accounts receivable (beg.) | $17,000 |
| Accounts receivable (end) | $20,000 |
| Inventory (beg.) | $10,000 |
| Inventory (end) | $15,000 |
| Total current assets | $65,000 |
| Total current liabilities | $42,000 |
Working Capital
- Working capital is the excess of current assets over current liabilities.
- Should be positive, higher is better!
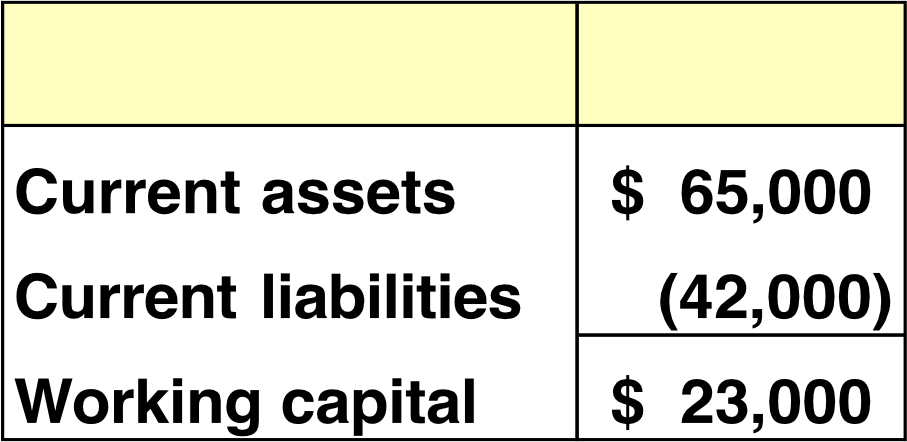
= $65,000 - $42,000 = $23,000
Analogy: How much "cushion" money does the company have after paying all bills due within a year?
Current Ratio
= \frac{$65,000}{$42,000} = 1.55 : 1
Measures the short-term debt-paying ability. A ratio > 1 means the company can cover its short-term debts. Think of it as: "For every 1.55 of assets."
Quick Ratio (Acid-Test Ratio)
Where Quick Assets = Cash + Marketable Securities + Receivables (excludes inventory & prepaid expenses)
= \frac{$50,000}{$42,000} = 1.19 : 1
Like the current ratio but stricter — strips out inventory which may take time to sell. If the quick ratio drops below 1, the company may struggle to pay short-term debts quickly.
Measures of Profitability
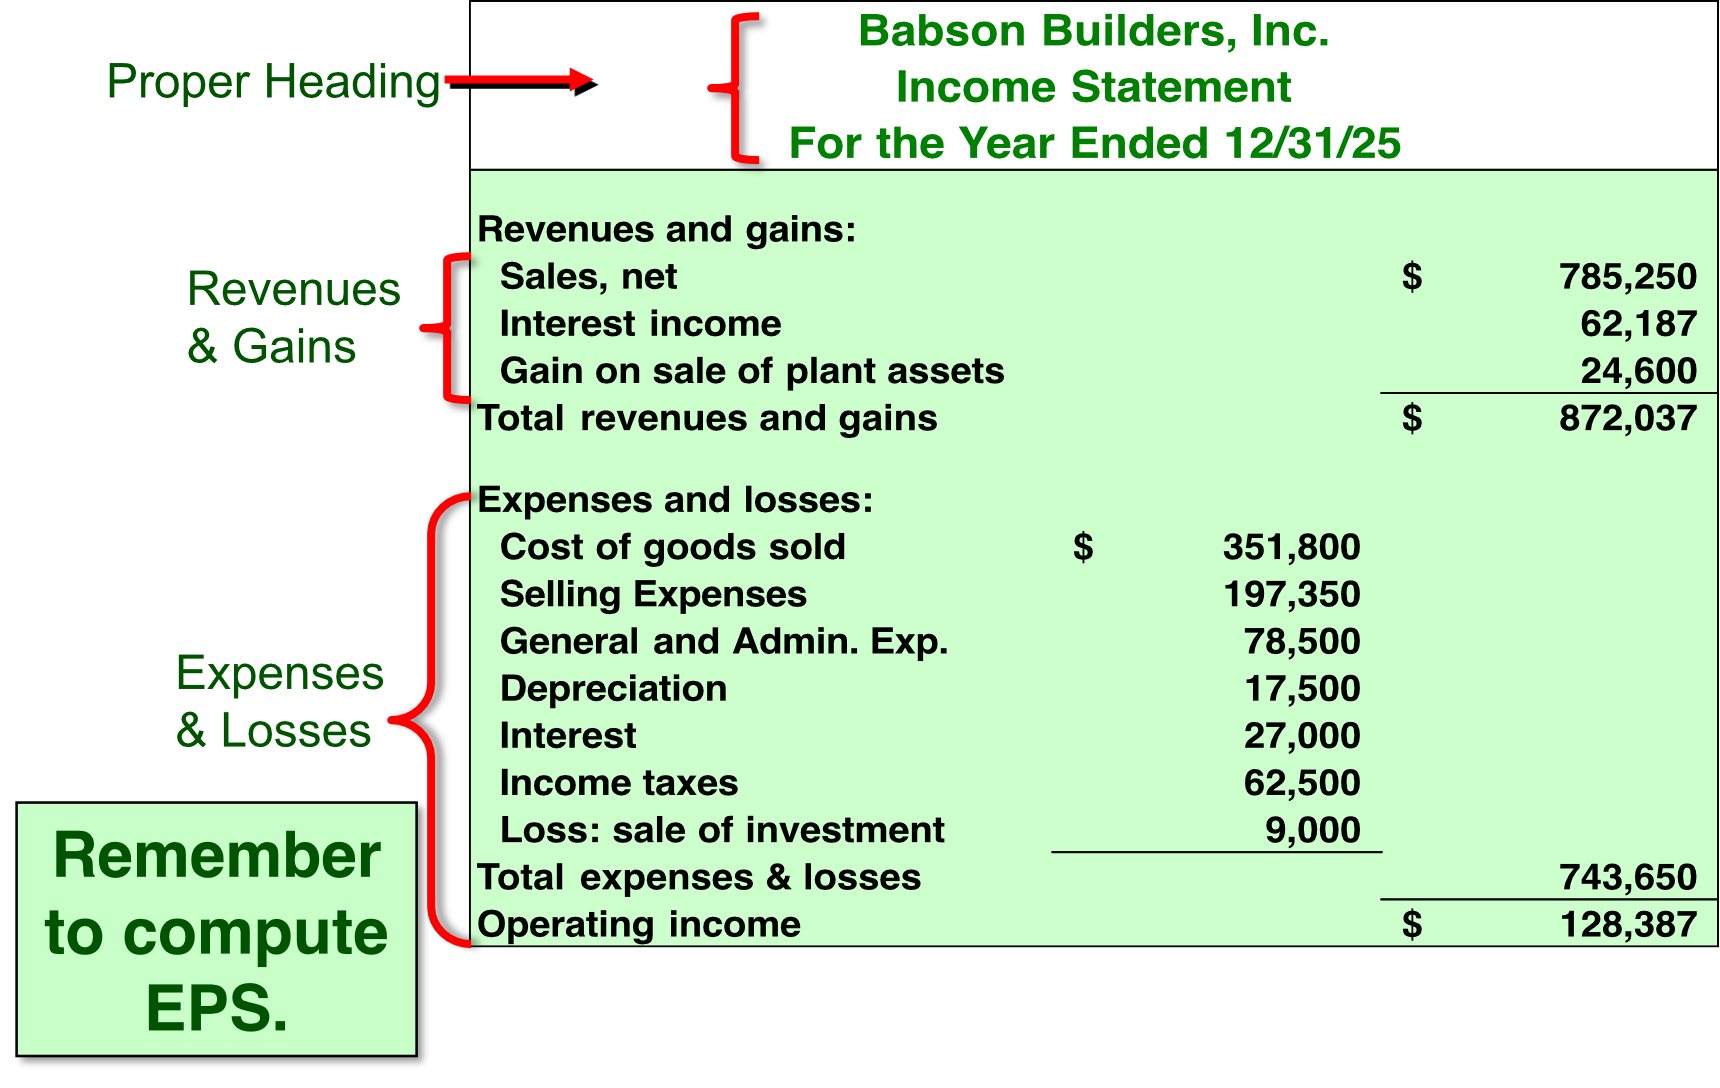
Income statements can be prepared in two formats:
- Single-step: Simpler — all revenues & gains listed, then all expenses & losses
- Multiple-step: More detailed — shows gross margin, operating income, non-operating items separately
Income Statement (Multiple-Step) — Babson Builders, Inc.
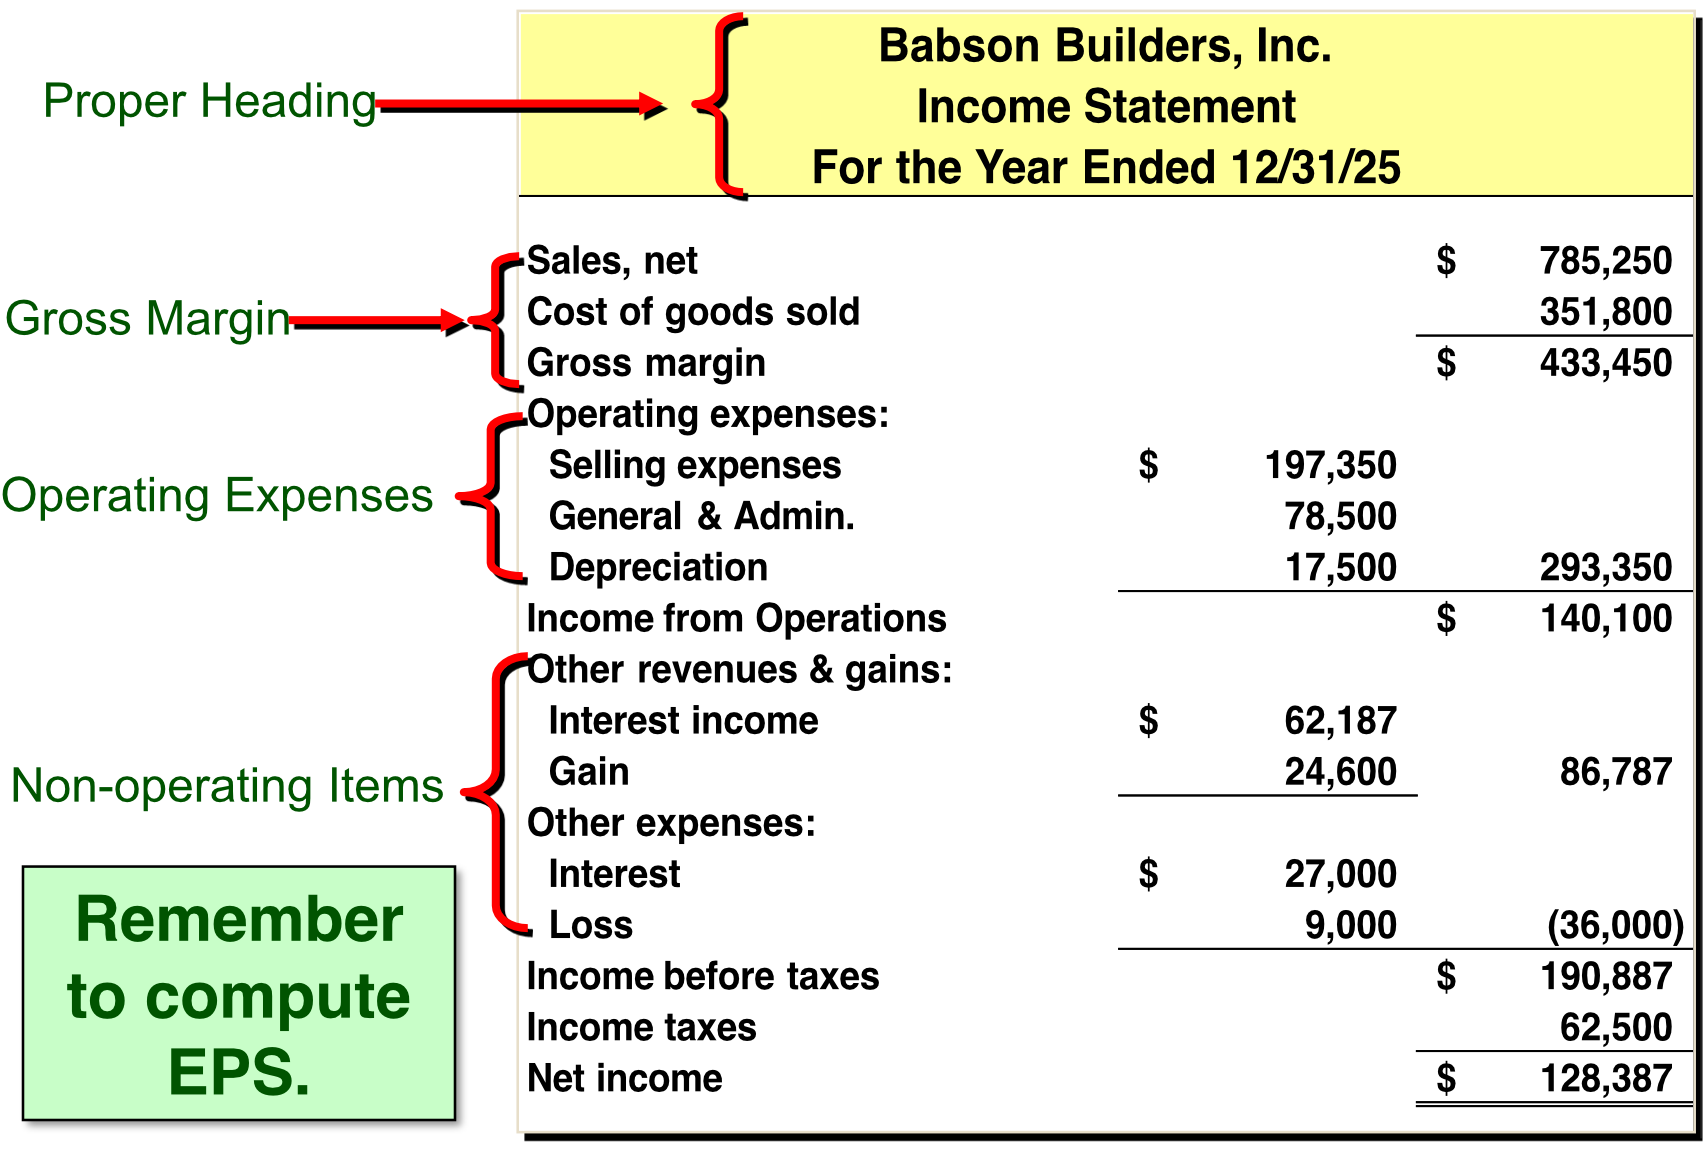
Remember to compute EPS (Earnings per share - กำไรต่อหุ้น).
-
Interest Income มาจาก เงินเราเหลือ ให้คนอื่นยืมไป (Note Receivable) แล้วก็จะได้ Interest มา
-
Gain, เราซื้อ equipment มาใช้ หลังจากใช้ไปแล้ว 10 ปี เก่าละ (อาจจะเป็น โต๊ะ, เก้าอี้) ก็ขายทิ้ง
- เราจะเอาไว้ตรงนี้ เพราะว่า profit ไม่ได้มาจาก product ที่เราขายตรง ๆ
-
ส่วนตรง Other expenses (Interst) - ก็อาจจะเป็น ที่เราไปกู้ธนาคารมา แล้วต้องจ่าย ดอกเบี้ย
Income Statement (Single-Step) — Babson Builders, Inc.
Profitability Ratios
Data used: Babson Builders, Inc. 2025
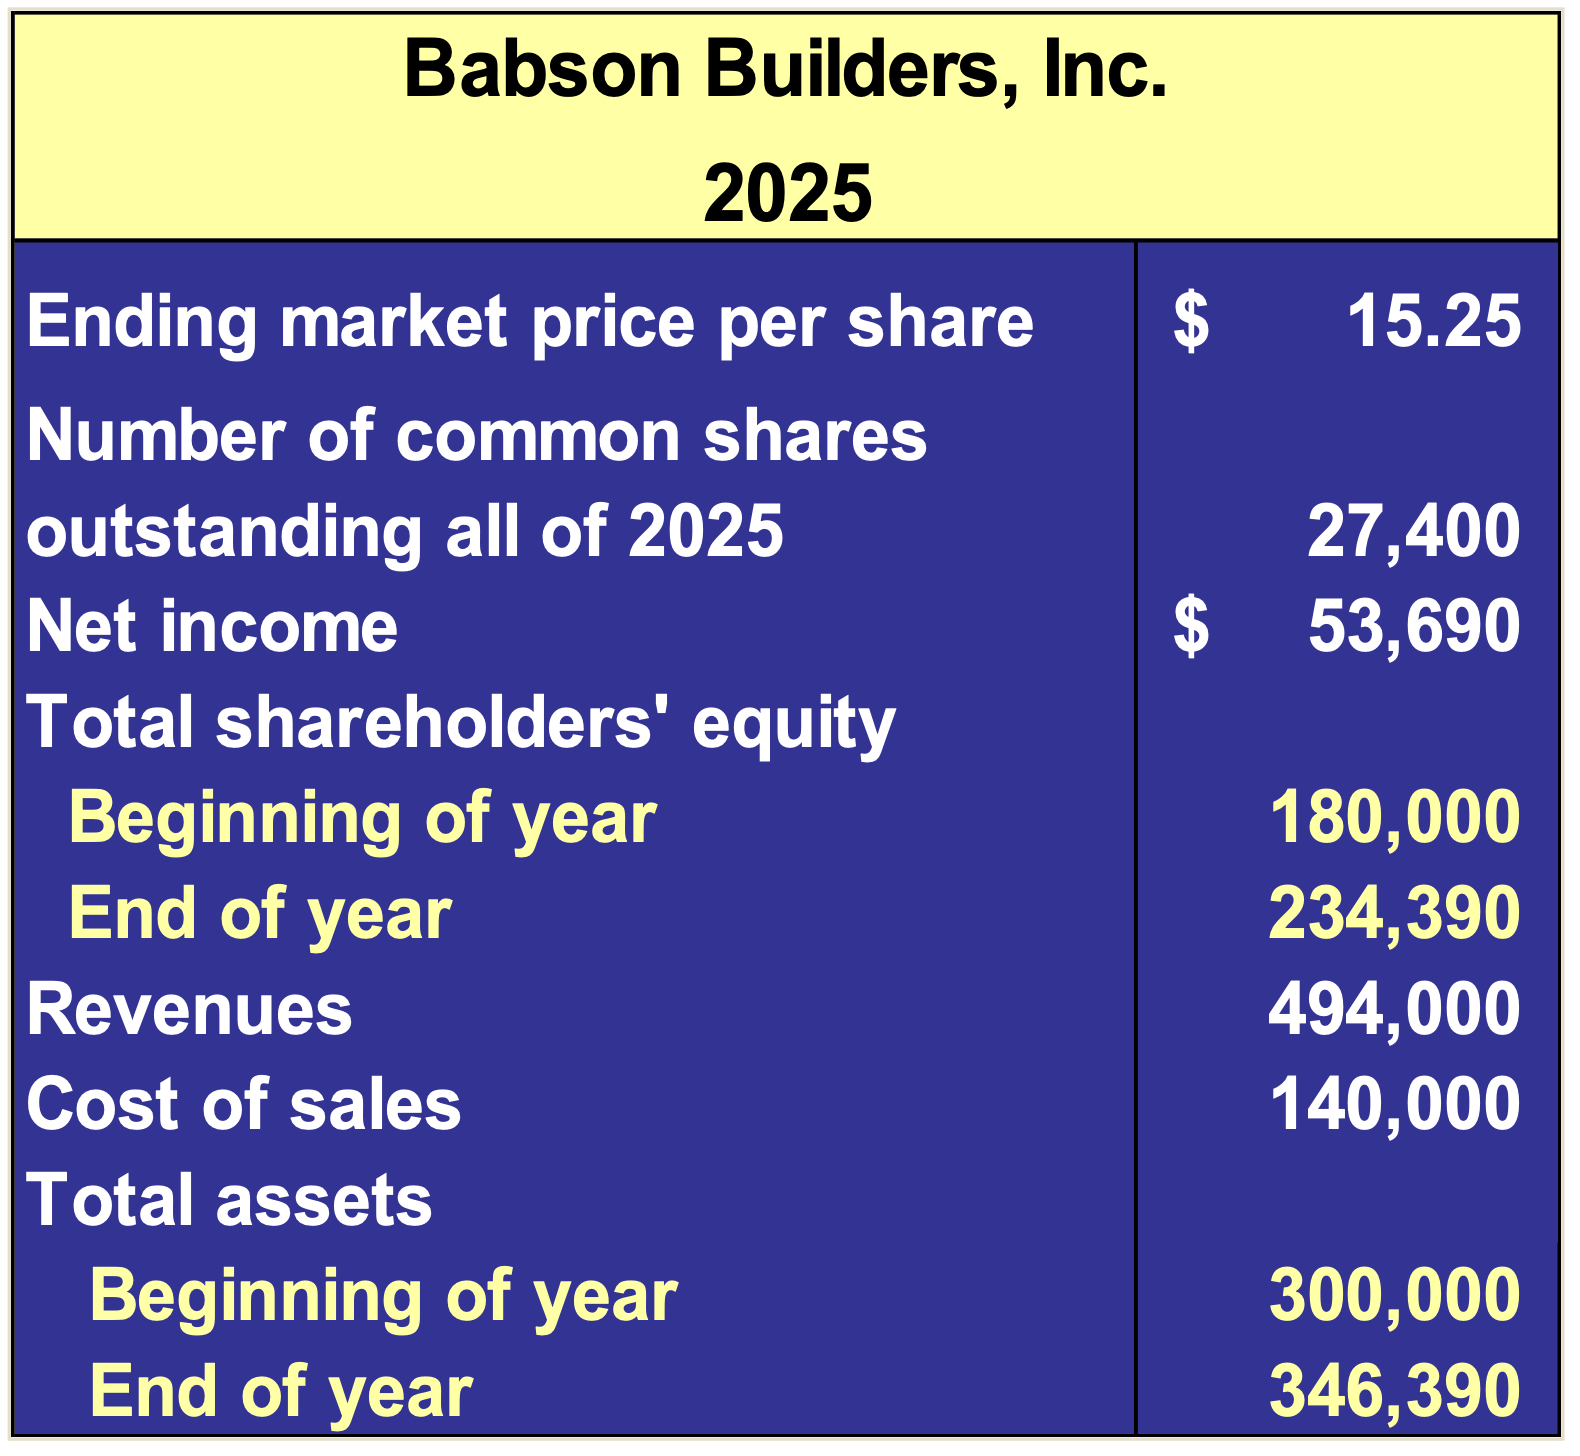
| Item | Value |
|---|---|
| Ending market price per share | $15.25 |
| Common shares outstanding | 27,400 |
| Net income | $53,690 |
| Total shareholders' equity (beg.) | $180,000 |
| Total shareholders' equity (end) | $234,390 |
| Revenues | $494,000 |
| Cost of sales | $140,000 |
| Total assets (beg.) | $300,000 |
| Total assets (end) | $346,390 |
Earnings Per Share (EPS)
= \frac{$53,690}{27,400} = $1.96
How much profit is attributed to each share. Investors use this to compare profitability across companies.
Price-Earnings (P/E) Ratio
= \frac{$15.25}{$1.96} = 7.78
Shows the relationship between a company's earnings and its market price. A higher P/E means investors expect higher future growth.
Return on Assets (ROA)
= \frac{$53,690}{($300,000 + $346,390) \div 2} = 16.61\%
Generally considered the best overall measure of profitability. Tells you how efficiently the company uses ALL its assets to generate profit. Higher = better.
Return on Equity (ROE)
= \frac{$53,690}{($180,000 + $234,390) \div 2} = 25.91\%
Measures how well the company uses owner investments to earn income. Higher ROE than ROA indicates that financial leverage (debt) is amplifying returns to shareholders.
Dividend Yield
= \frac{$1.50}{$15.25} = 9.84\%
Identifies the return in terms of cash dividends on the current market price. Useful for income-focused investors.
Analysis by Long-Term Creditors
Data: Babson Builders, Inc. 2025
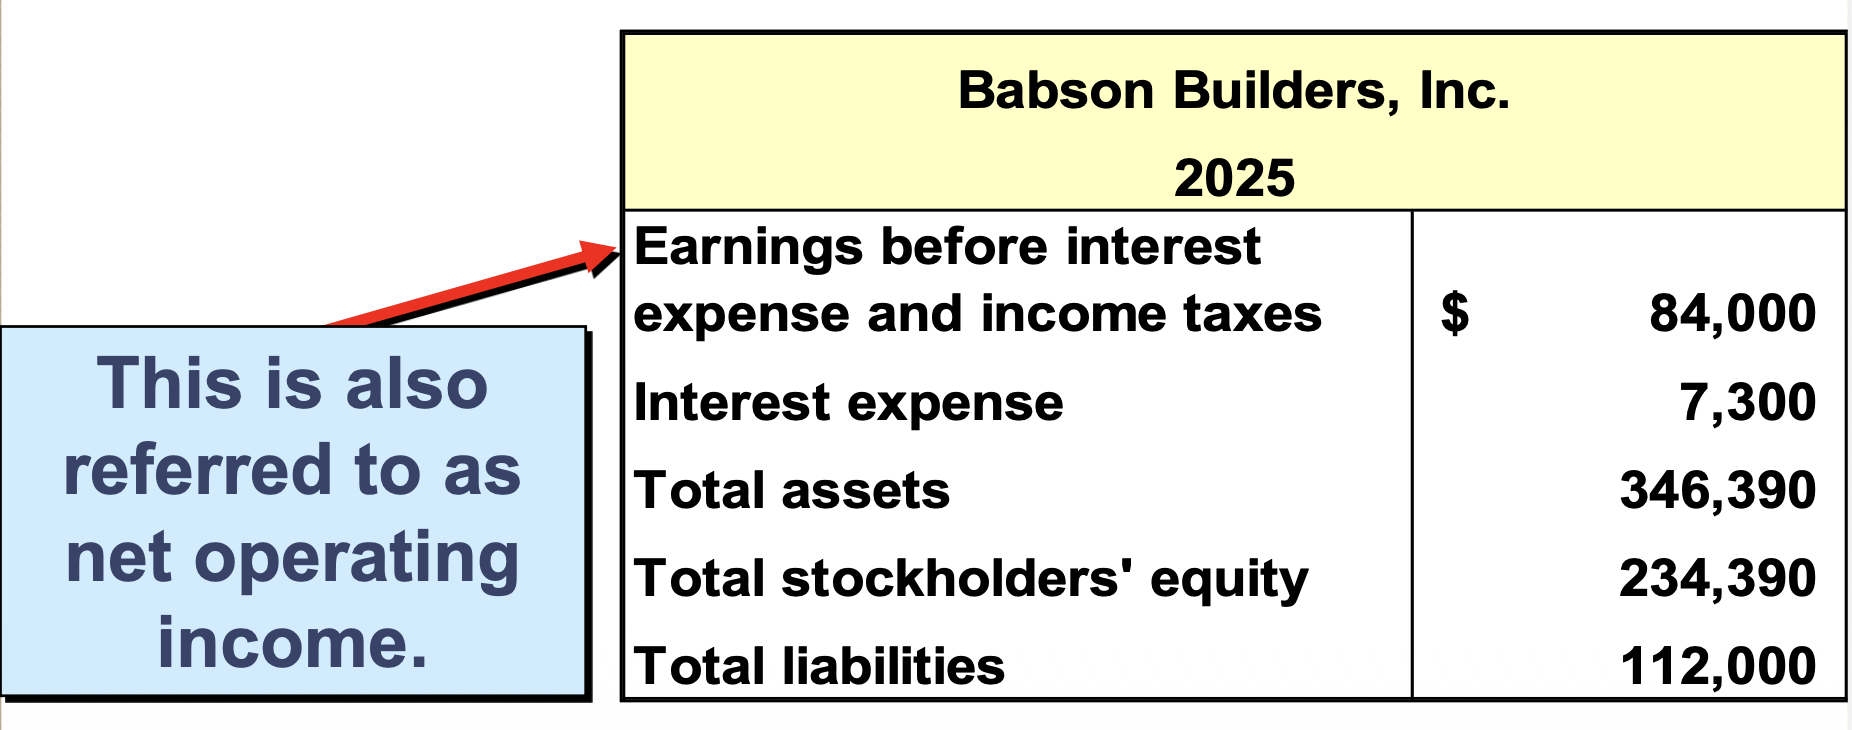
| Item | Value |
|---|---|
| EBIT (Earnings before interest & taxes) | $84,000 |
| Interest expense | $7,300 |
| Total assets | $346,390 |
| Total stockholders' equity | $234,390 |
| Total liabilities | $112,000 |
Note: EBIT = Earnings Before Interest and Taxes = also called Net Operating Income
Times Interest Earned (Interest Coverage Ratio)
- The ability to pay ???
- Higher the better - how many times can the company pay the interest expensees
= \frac{$84,000}{$7,300} = 11.5 \text{ times}
The most common measure of a firm's ability to protect its long-term creditors. A higher number = safer for creditors. If this ratio approaches 1, the company barely earns enough to cover interest payments.
Debt Ratio
= \frac{$112,000}{$346,390} = 32.33\%
Measures creditor's long-term risk. Smaller % = less risk for creditors (company relies less on debt). Think: "What fraction of everything we own was funded by borrowed money?"
Analysis by Short-Term Creditors
Data: Babson Builders, Inc. 2025
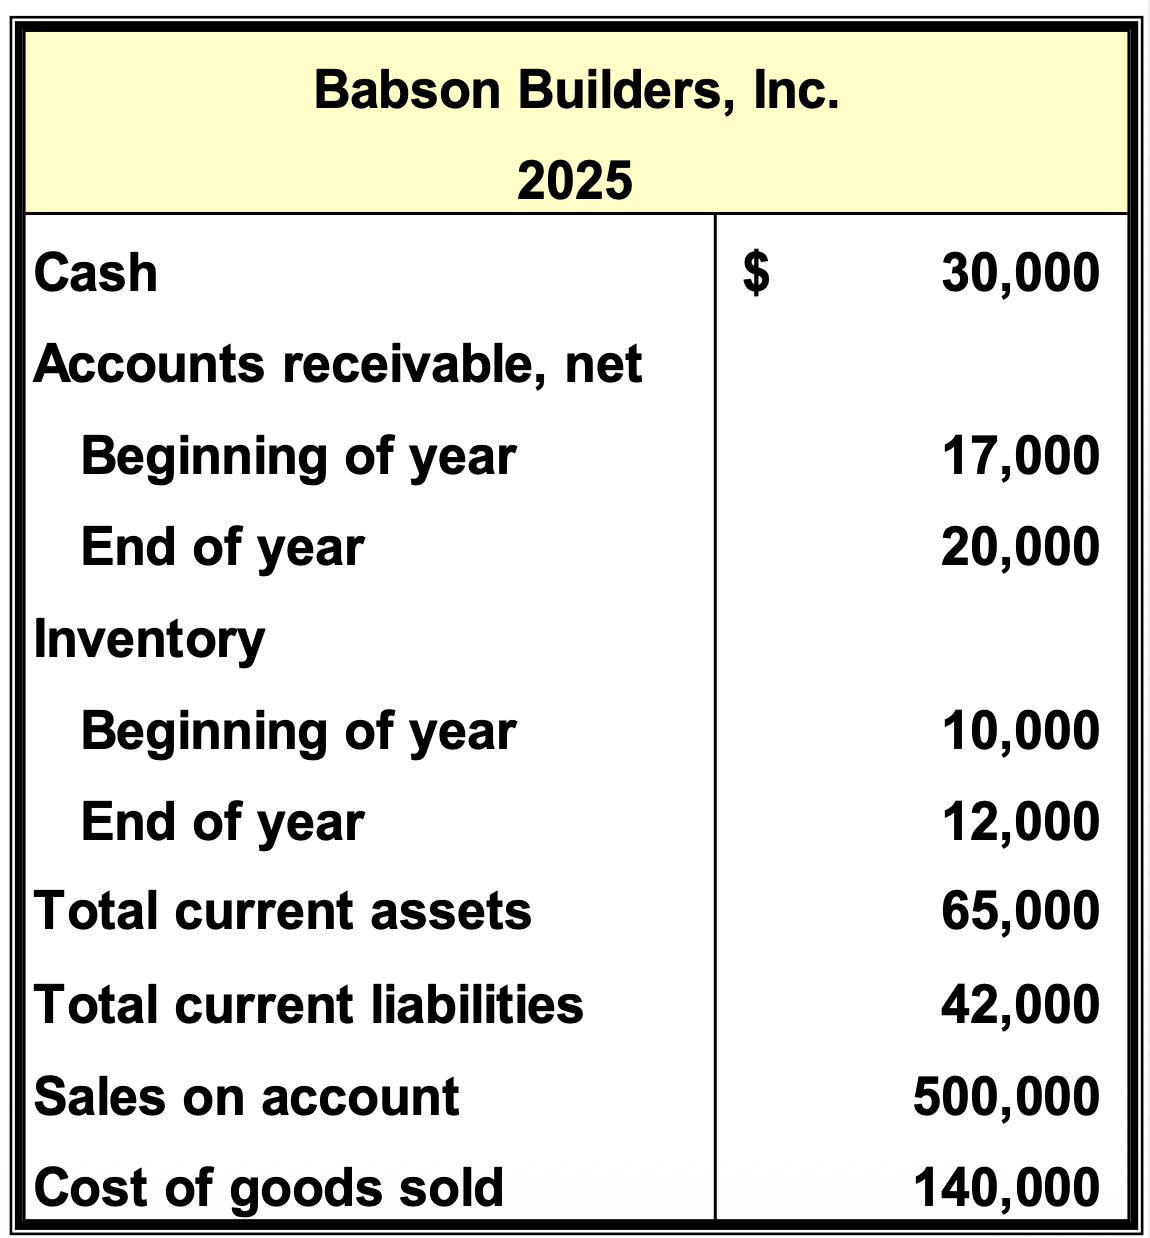
| Item | Value |
|---|---|
| Cash | $30,000 |
| Accounts receivable (beg.) | $17,000 |
| Accounts receivable (end) | $20,000 |
| Inventory (beg.) | $10,000 |
| Inventory (end) | $12,000 |
| Total current assets | $65,000 |
| Total current liabilities | $42,000 |
| Sales on account | $500,000 |
| Cost of goods sold | $140,000 |
Accounts Receivable Turnover Rate
= \frac{$500,000}{($17,000 + $20,000) \div 2} = 27.03 \text{ times}
Measures how many times a company converts its receivables into cash each year. Higher = better — customers are paying faster, less cash is tied up.
Inventory Turnover Rate
- ยิ่งสูงยิ่งดี — ถ้าต่ำ = สินค้าค้างสต็อก ขายไม่ออก
= \frac{$140,000}{($10,000 + $12,000) \div 2} = 12.73 \text{ times}
Measures how many times merchandise inventory is sold and replaced during the year. Higher = faster-moving goods = efficient inventory management.
Operating Cycle
The operating cycle flows through three stages:
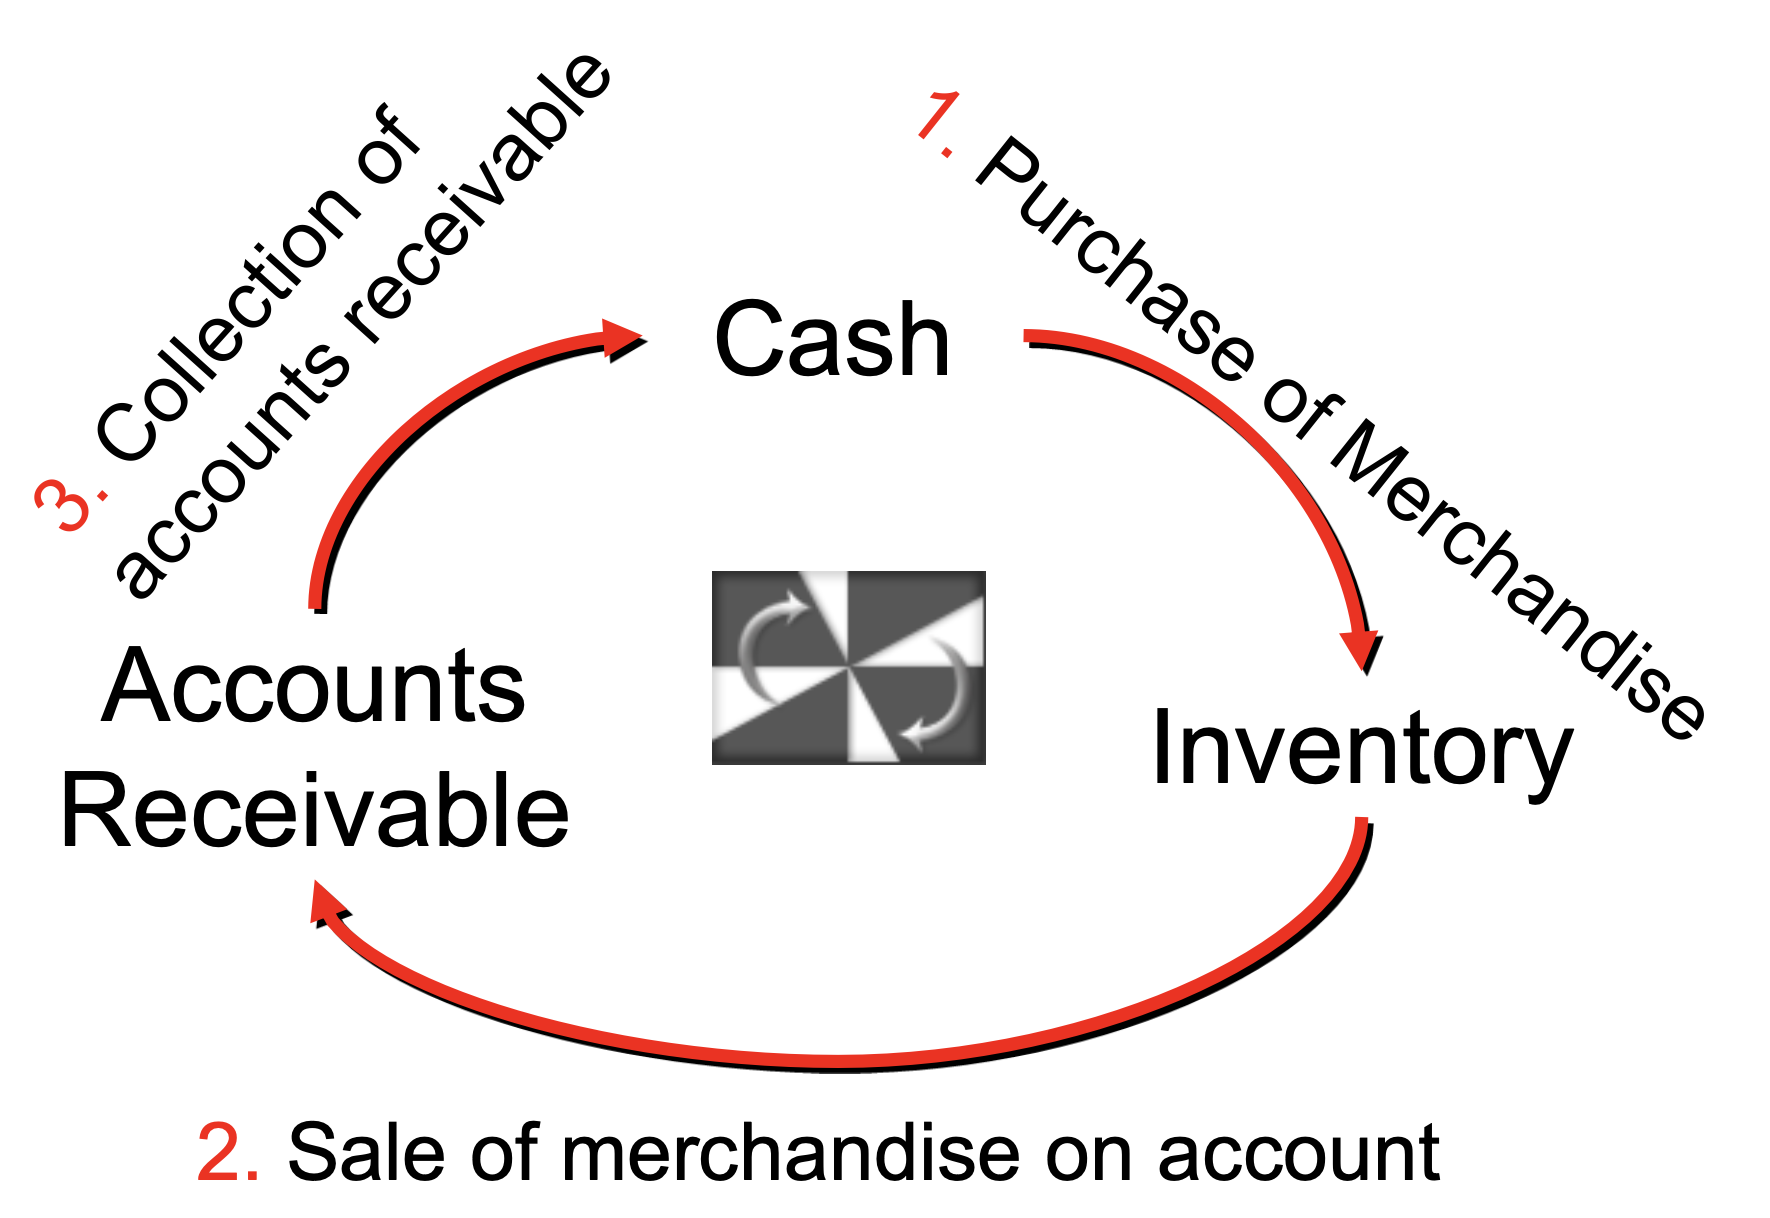
Cash → (1. Purchase of Merchandise) → Inventory
     → (2. Sale on Account)         → Accounts Receivable
     → (3. Collection)              → Cash
Analogy: Think of it like a food stall — you spend cash to buy ingredients (inventory), sell to customers on credit, then collect cash from them. The faster the cycle, the healthier the cash flow.
Summary: Key Ratios Quick Reference
| Ratio | Formula | What It Measures |
|---|---|---|
| Working Capital | Current Assets − Current Liabilities | Short-term financial cushion |
| Current Ratio | Current Assets ÷ Current Liabilities | Short-term debt-paying ability |
| Quick Ratio | Quick Assets ÷ Current Liabilities | Immediate liquidity (no inventory) |
| EPS | Net Income ÷ Avg. Shares Outstanding | Profit per share |
| P/E Ratio | Market Price ÷ EPS | Market valuation vs. earnings |
| ROA | Net Income ÷ Avg. Total Assets | Overall profitability efficiency |
| ROE | Net Income ÷ Avg. Total Equity | Return to shareholders |
| Dividend Yield | Dividends/Share ÷ Market Price/Share | Cash return to investors |
| Times Interest Earned | EBIT ÷ Interest Expense | Ability to cover interest payments |
| Debt Ratio | Total Liabilities ÷ Total Assets | Long-term creditor risk |
| AR Turnover | Net Sales ÷ Avg. AR | Receivables collection speed |
| Inventory Turnover | COGS ÷ Avg. Inventory | Inventory selling speed |
Net sale vs net icome? เลือกอะไร เวลาเปิด แนทยฟืั