Problem 1: Student Performance Analysis (RDD)
Problem Statement
Given a dataset of student exam scores, compute the average score per student and identify top-performing students.
Concepts Covered
textFilemapfilterreduceByKey- Key-value RDDs
Tasks
- Load the data as an RDD
- Compute average score per student
- Identify students with average scores ≥ 80
Instructions
Step 1: Open terminal and run PySpark shell in the directory containing the dataset
pysparkStep 2: Execute the following code
# Load the data
rdd = sc.textFile("students.csv")

# Remove header
header = rdd.first()
data = rdd.filter(lambda x: x != header)

# Map to (student_name, score)
student_scores = data.map(lambda x: x.split(",")) \
                     .map(lambda x: (x[1], int(x[3])))

# Compute sum and count per student
sum_count = student_scores.mapValues(lambda x: (x, 1)) \
                          .reduceByKey(lambda a, b: (a[0] + b[0], a[1] + b[1]))

# Calculate average scores
avg_scores = sum_count.mapValues(lambda x: x[0] / x[1])

# Filter top students (average >= 80)
top_students = avg_scores.filter(lambda x: x[1] >= 80)

# Collect and display results
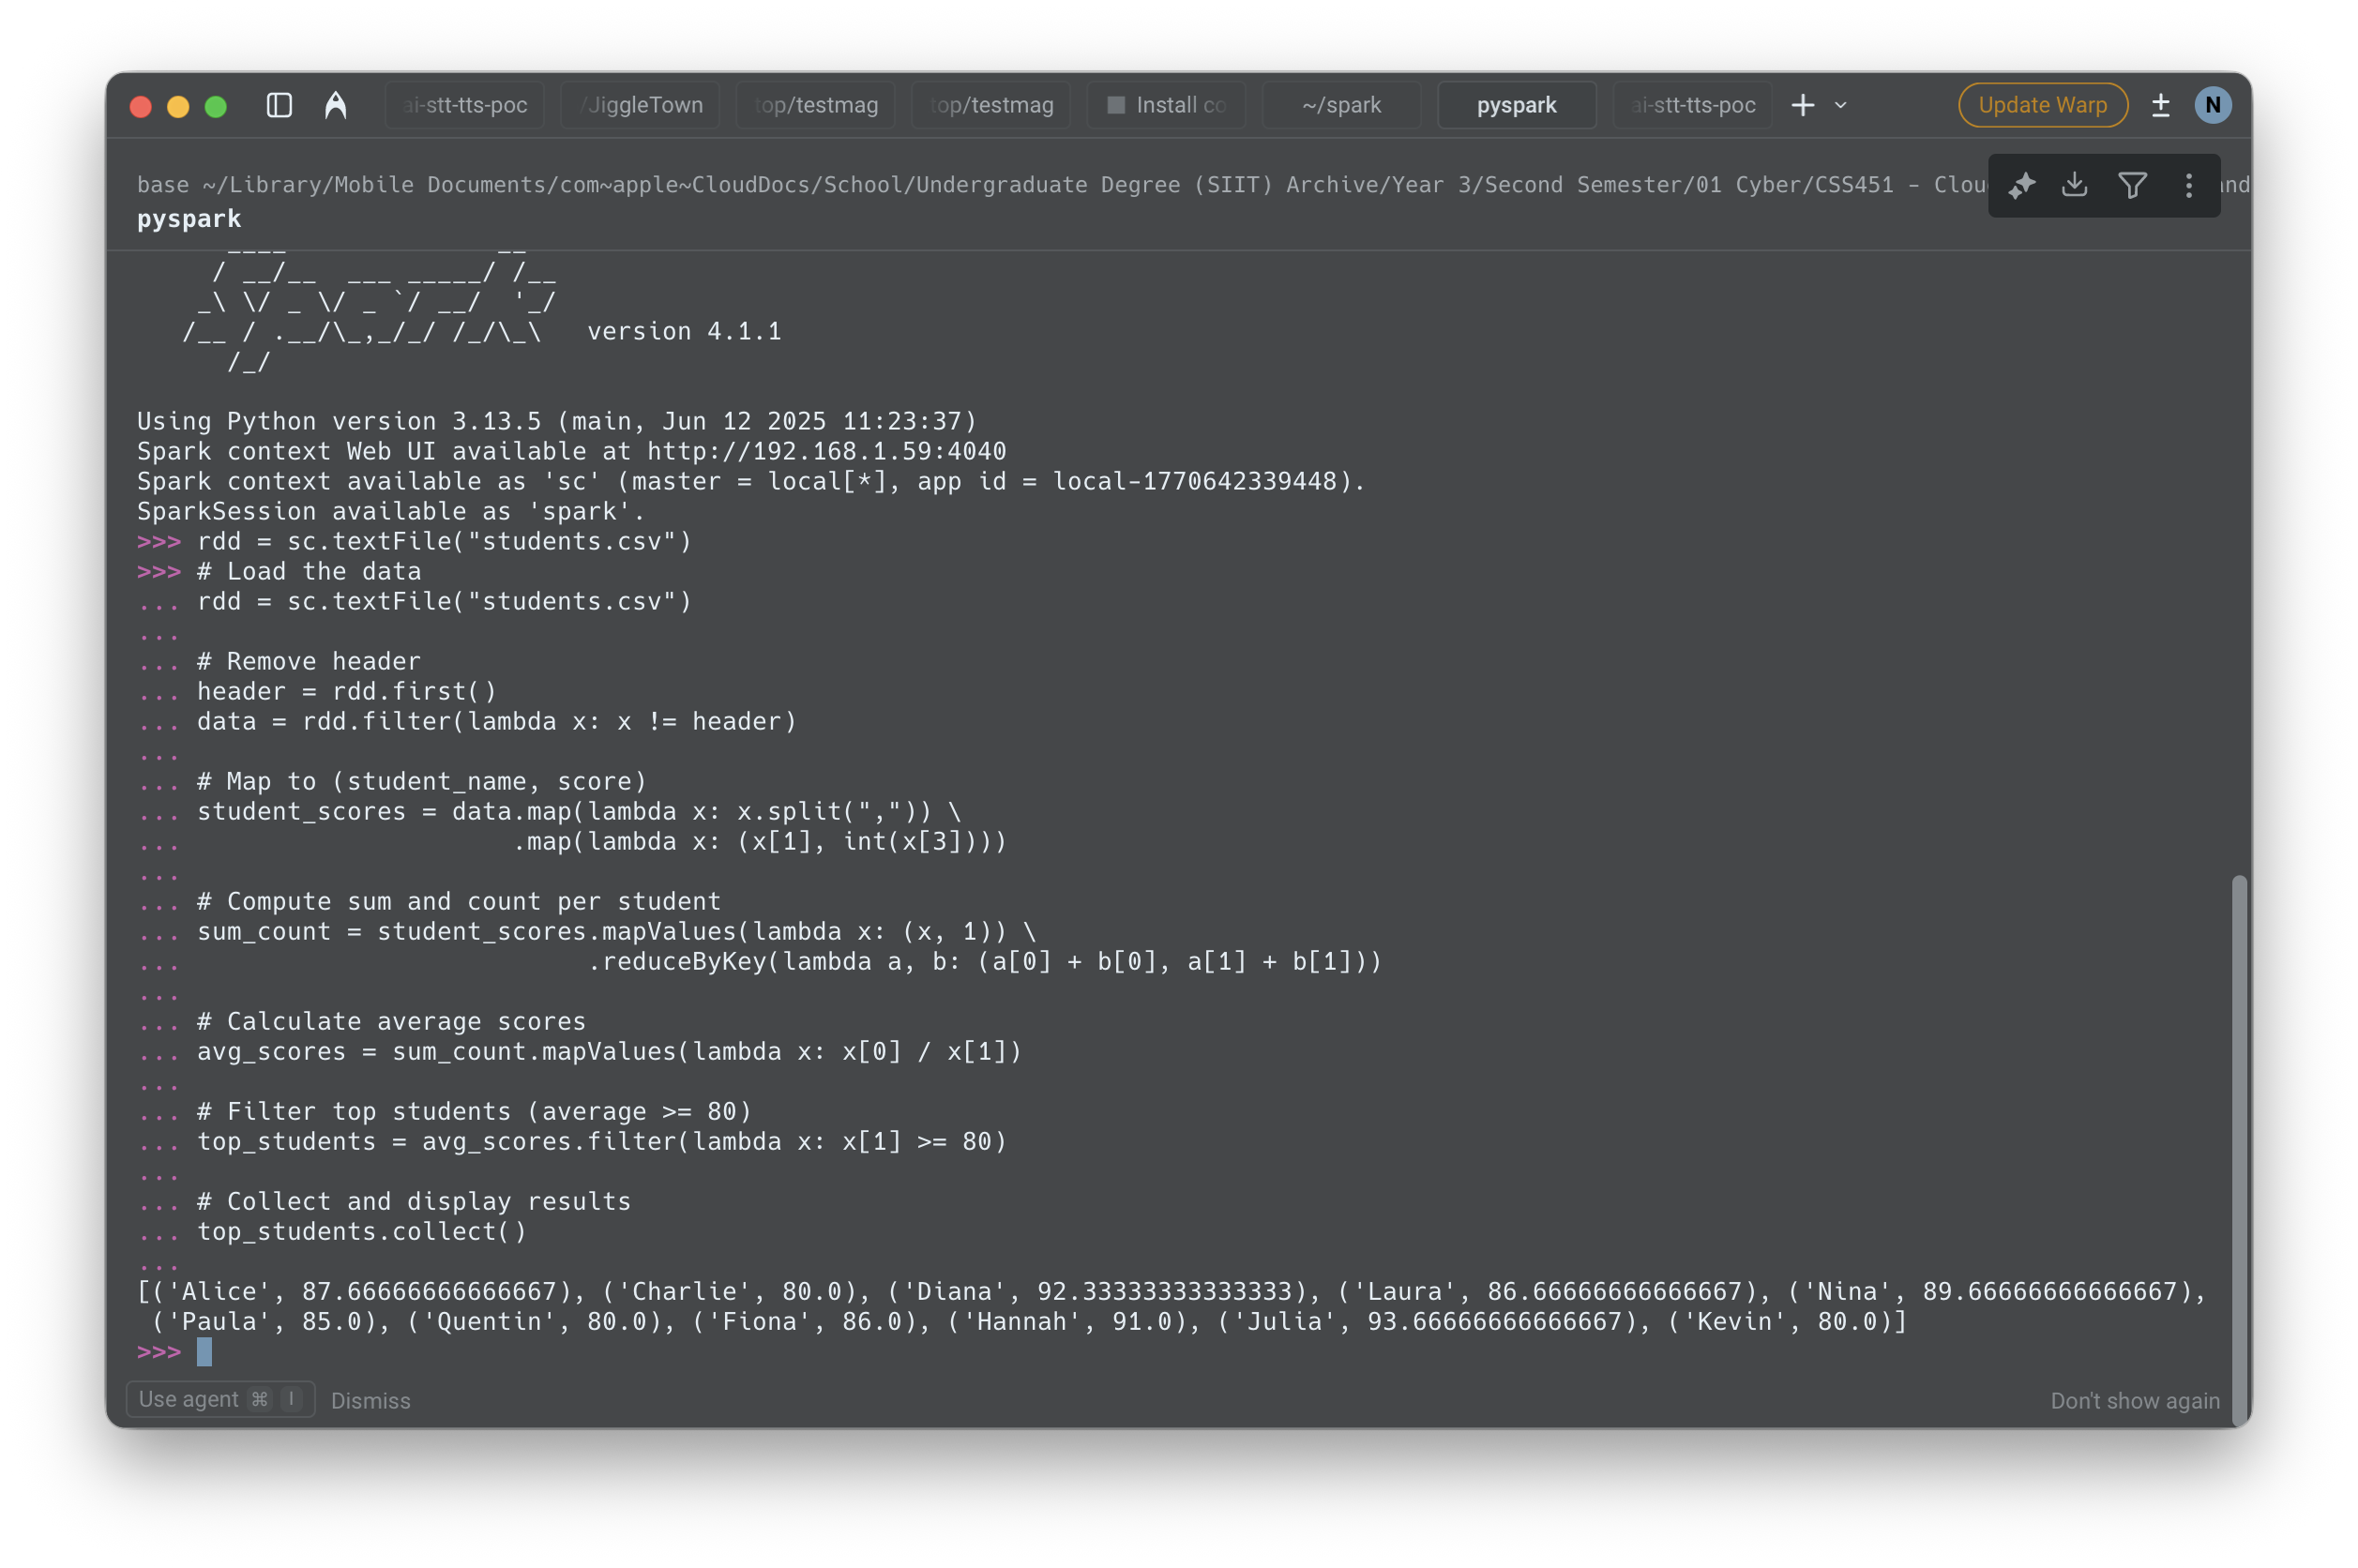
top_students.collect()
📸 Capture the output screenshot
Problem 2: Partitioning and Caching with RDDs
Problem Statement
Given a dataset of sales transactions, analyze how Apache Spark partitions data and improves performance using caching in a distributed environment.
Dataset
sales.csv
Concepts Covered
textFilemapfilterreduceByKey- Counting events using RDDs
- Key-value RDD processing
- Partitioning
- Caching
Tasks
- Load the dataset as an RDD
- Determine the default number of partitions
- Repartition the RDD to use 4 partitions
- Cache the repartitioned RDD and trigger an action
Instructions
# Load the data
rdd = sc.textFile("sales.csv")

# Remove header
header = rdd.first()
data = rdd.filter(lambda x: x != header)

# Check default partitions
data.getNumPartitions()

# Repartition to 4 partitions
repartitioned_rdd = data.repartition(4)
repartitioned_rdd.getNumPartitions()

# Cache the RDD and trigger an action
repartitioned_rdd.cache()
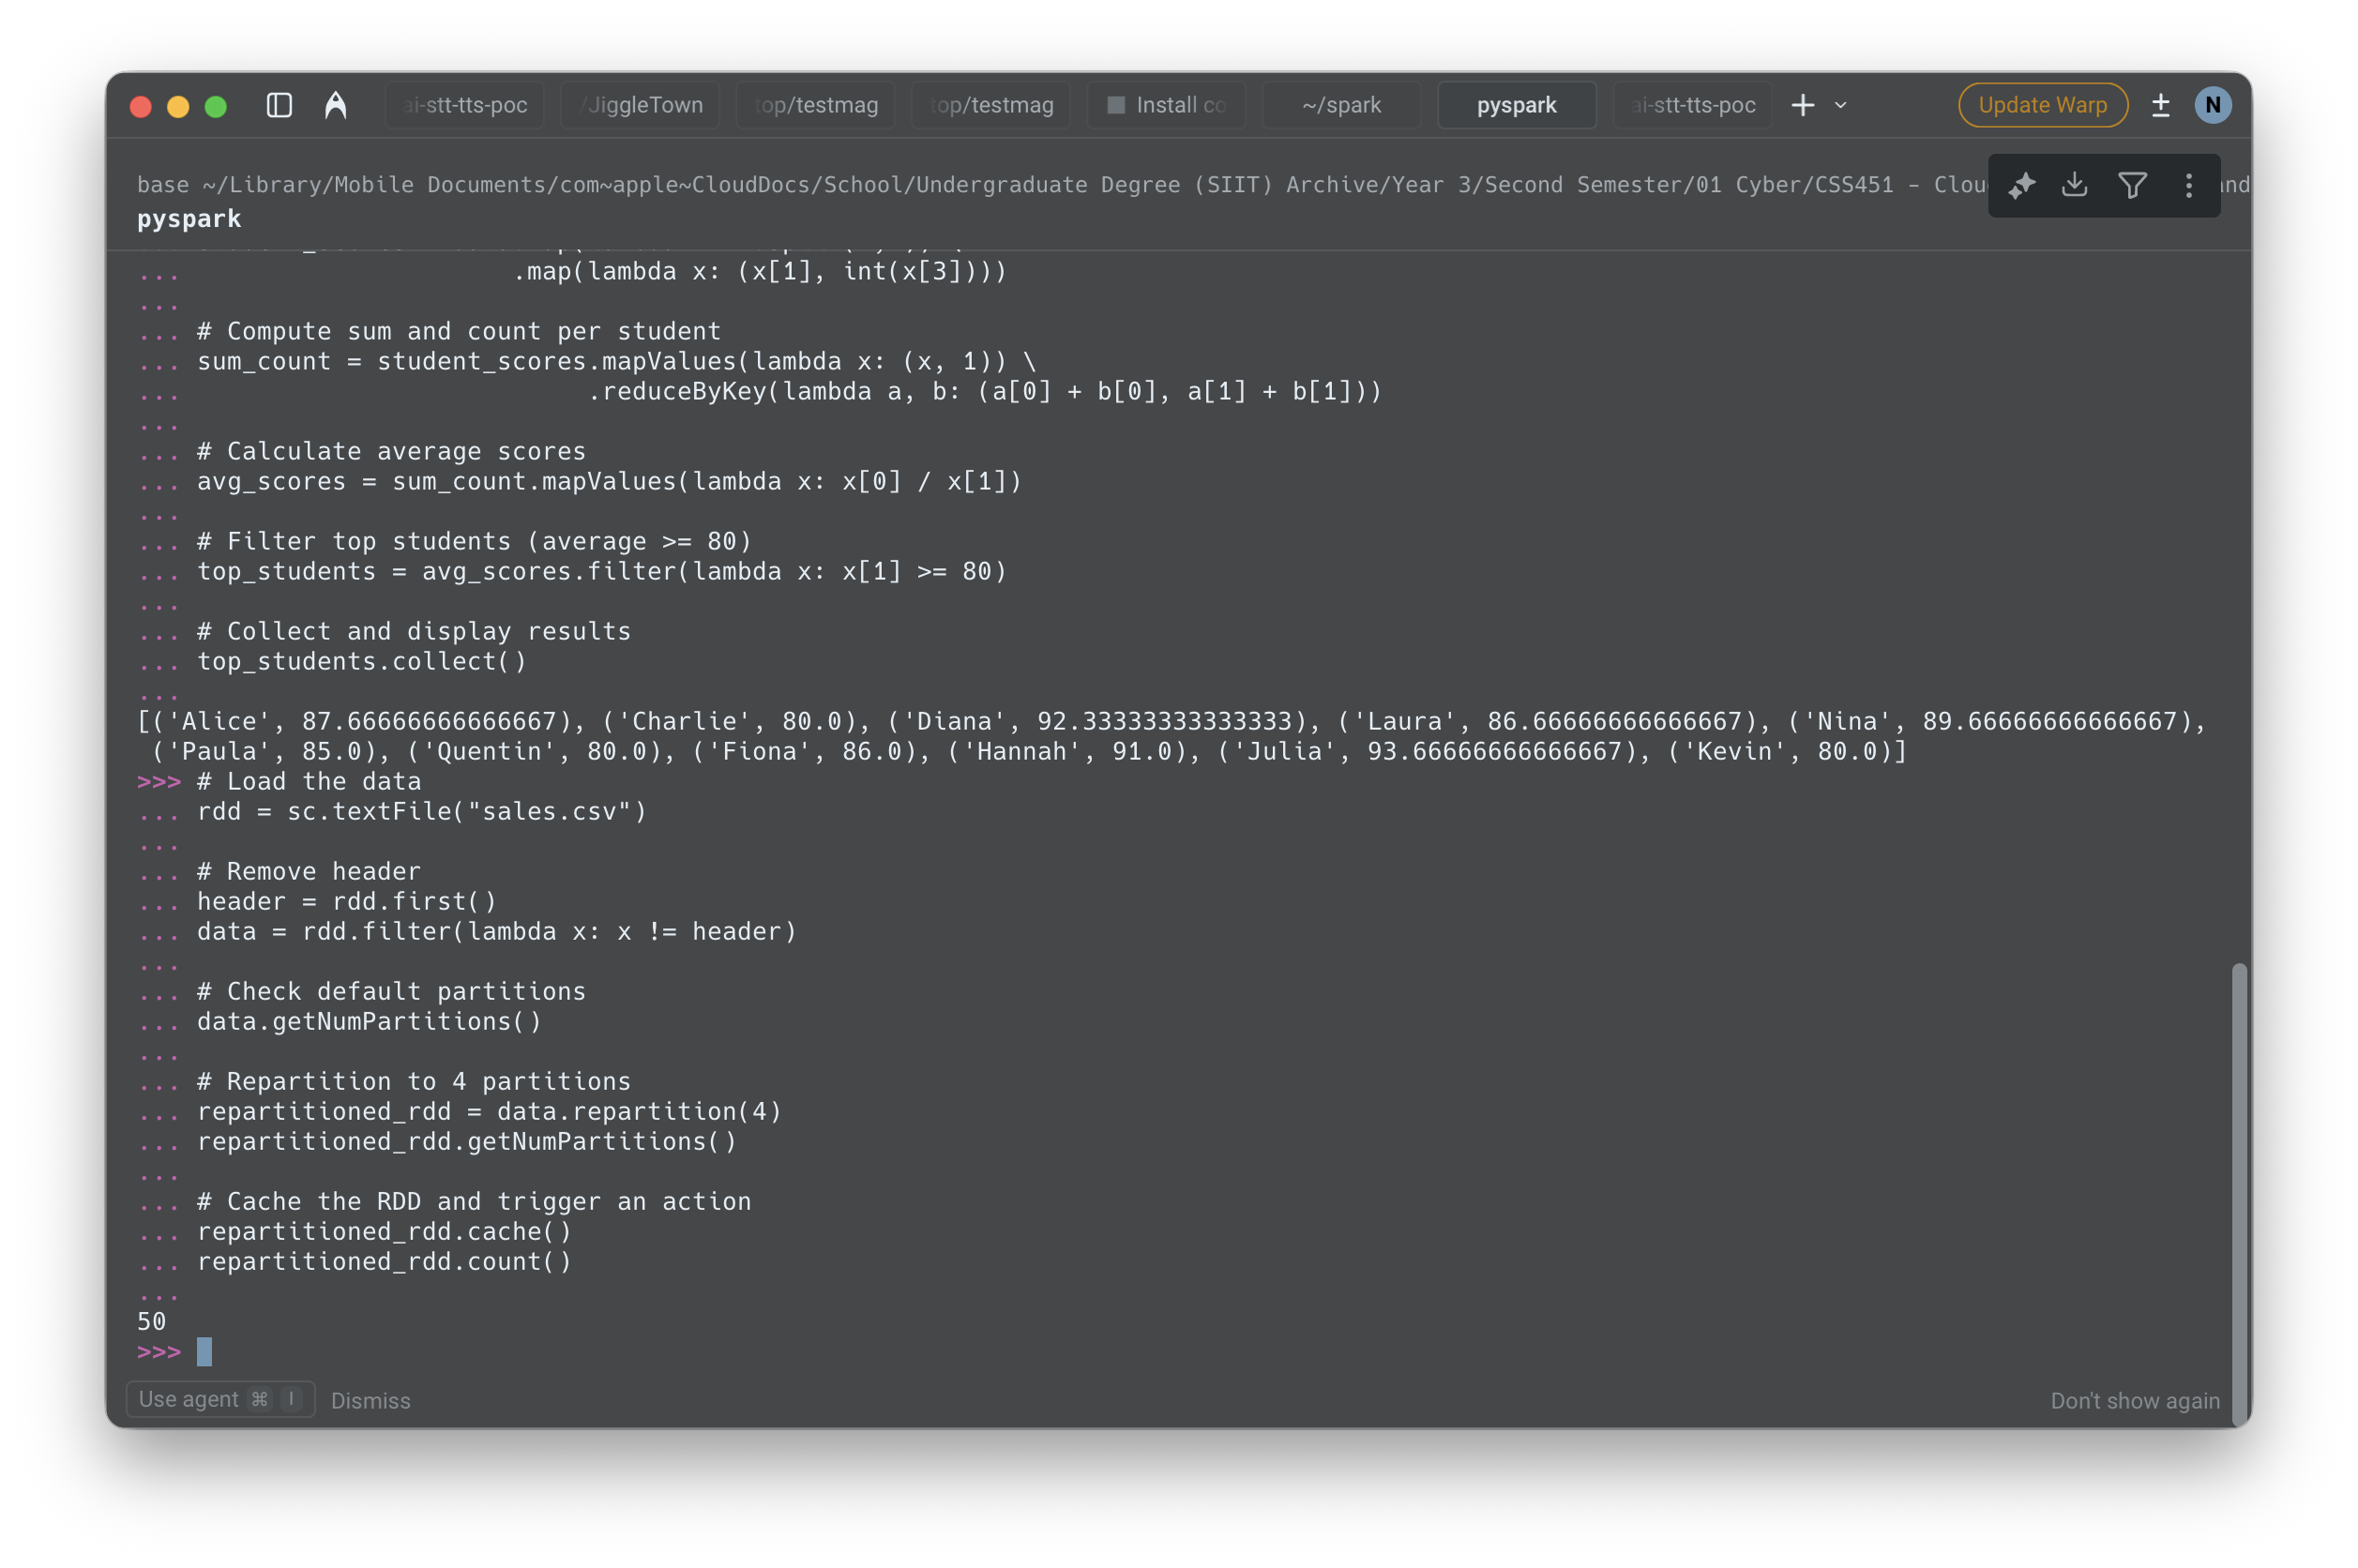
repartitioned_rdd.count()
📸 Capture the output screenshot
Problem 3: Analytical Processing Using RDDs
Problem Statement
Given a dataset of sales transactions, perform analytical computations using RDD transformations to derive meaningful insights.
Dataset
region_sales.csv
Concepts Covered
- Analytical processing with RDDs
countmapreduceByKey- Composite values (sum, count)
takeOrdered- Distributed analytics
Tasks
- Load the dataset as an RDD
- Compute the total number of transactions
- Compute the average sales amount per region
- Identify the region with the highest total sales
Instructions
# Load the data
rdd = sc.textFile("region_sales.csv")

# Remove header
header = rdd.first()
data = rdd.filter(lambda x: x != header)

# Total number of transactions
data.count()

# Map to (region, (amount, 1))
region_pairs = data.map(lambda x: x.split(",")) \
                   .map(lambda x: (x[1], (int(x[3]), 1)))

# Sum and count per region
region_sum_count = region_pairs.reduceByKey(
    lambda a, b: (a[0] + b[0], a[1] + b[1])
)

# Average sales per region
region_avg = region_sum_count.mapValues(lambda x: x[0] / x[1])
region_avg.collect()

# Total sales per region
region_total = region_pairs.mapValues(lambda x: x[0]) \
                           .reduceByKey(lambda a, b: a + b)

# Region with highest sales
top_region = region_total.takeOrdered(1, key=lambda x: -x[1])
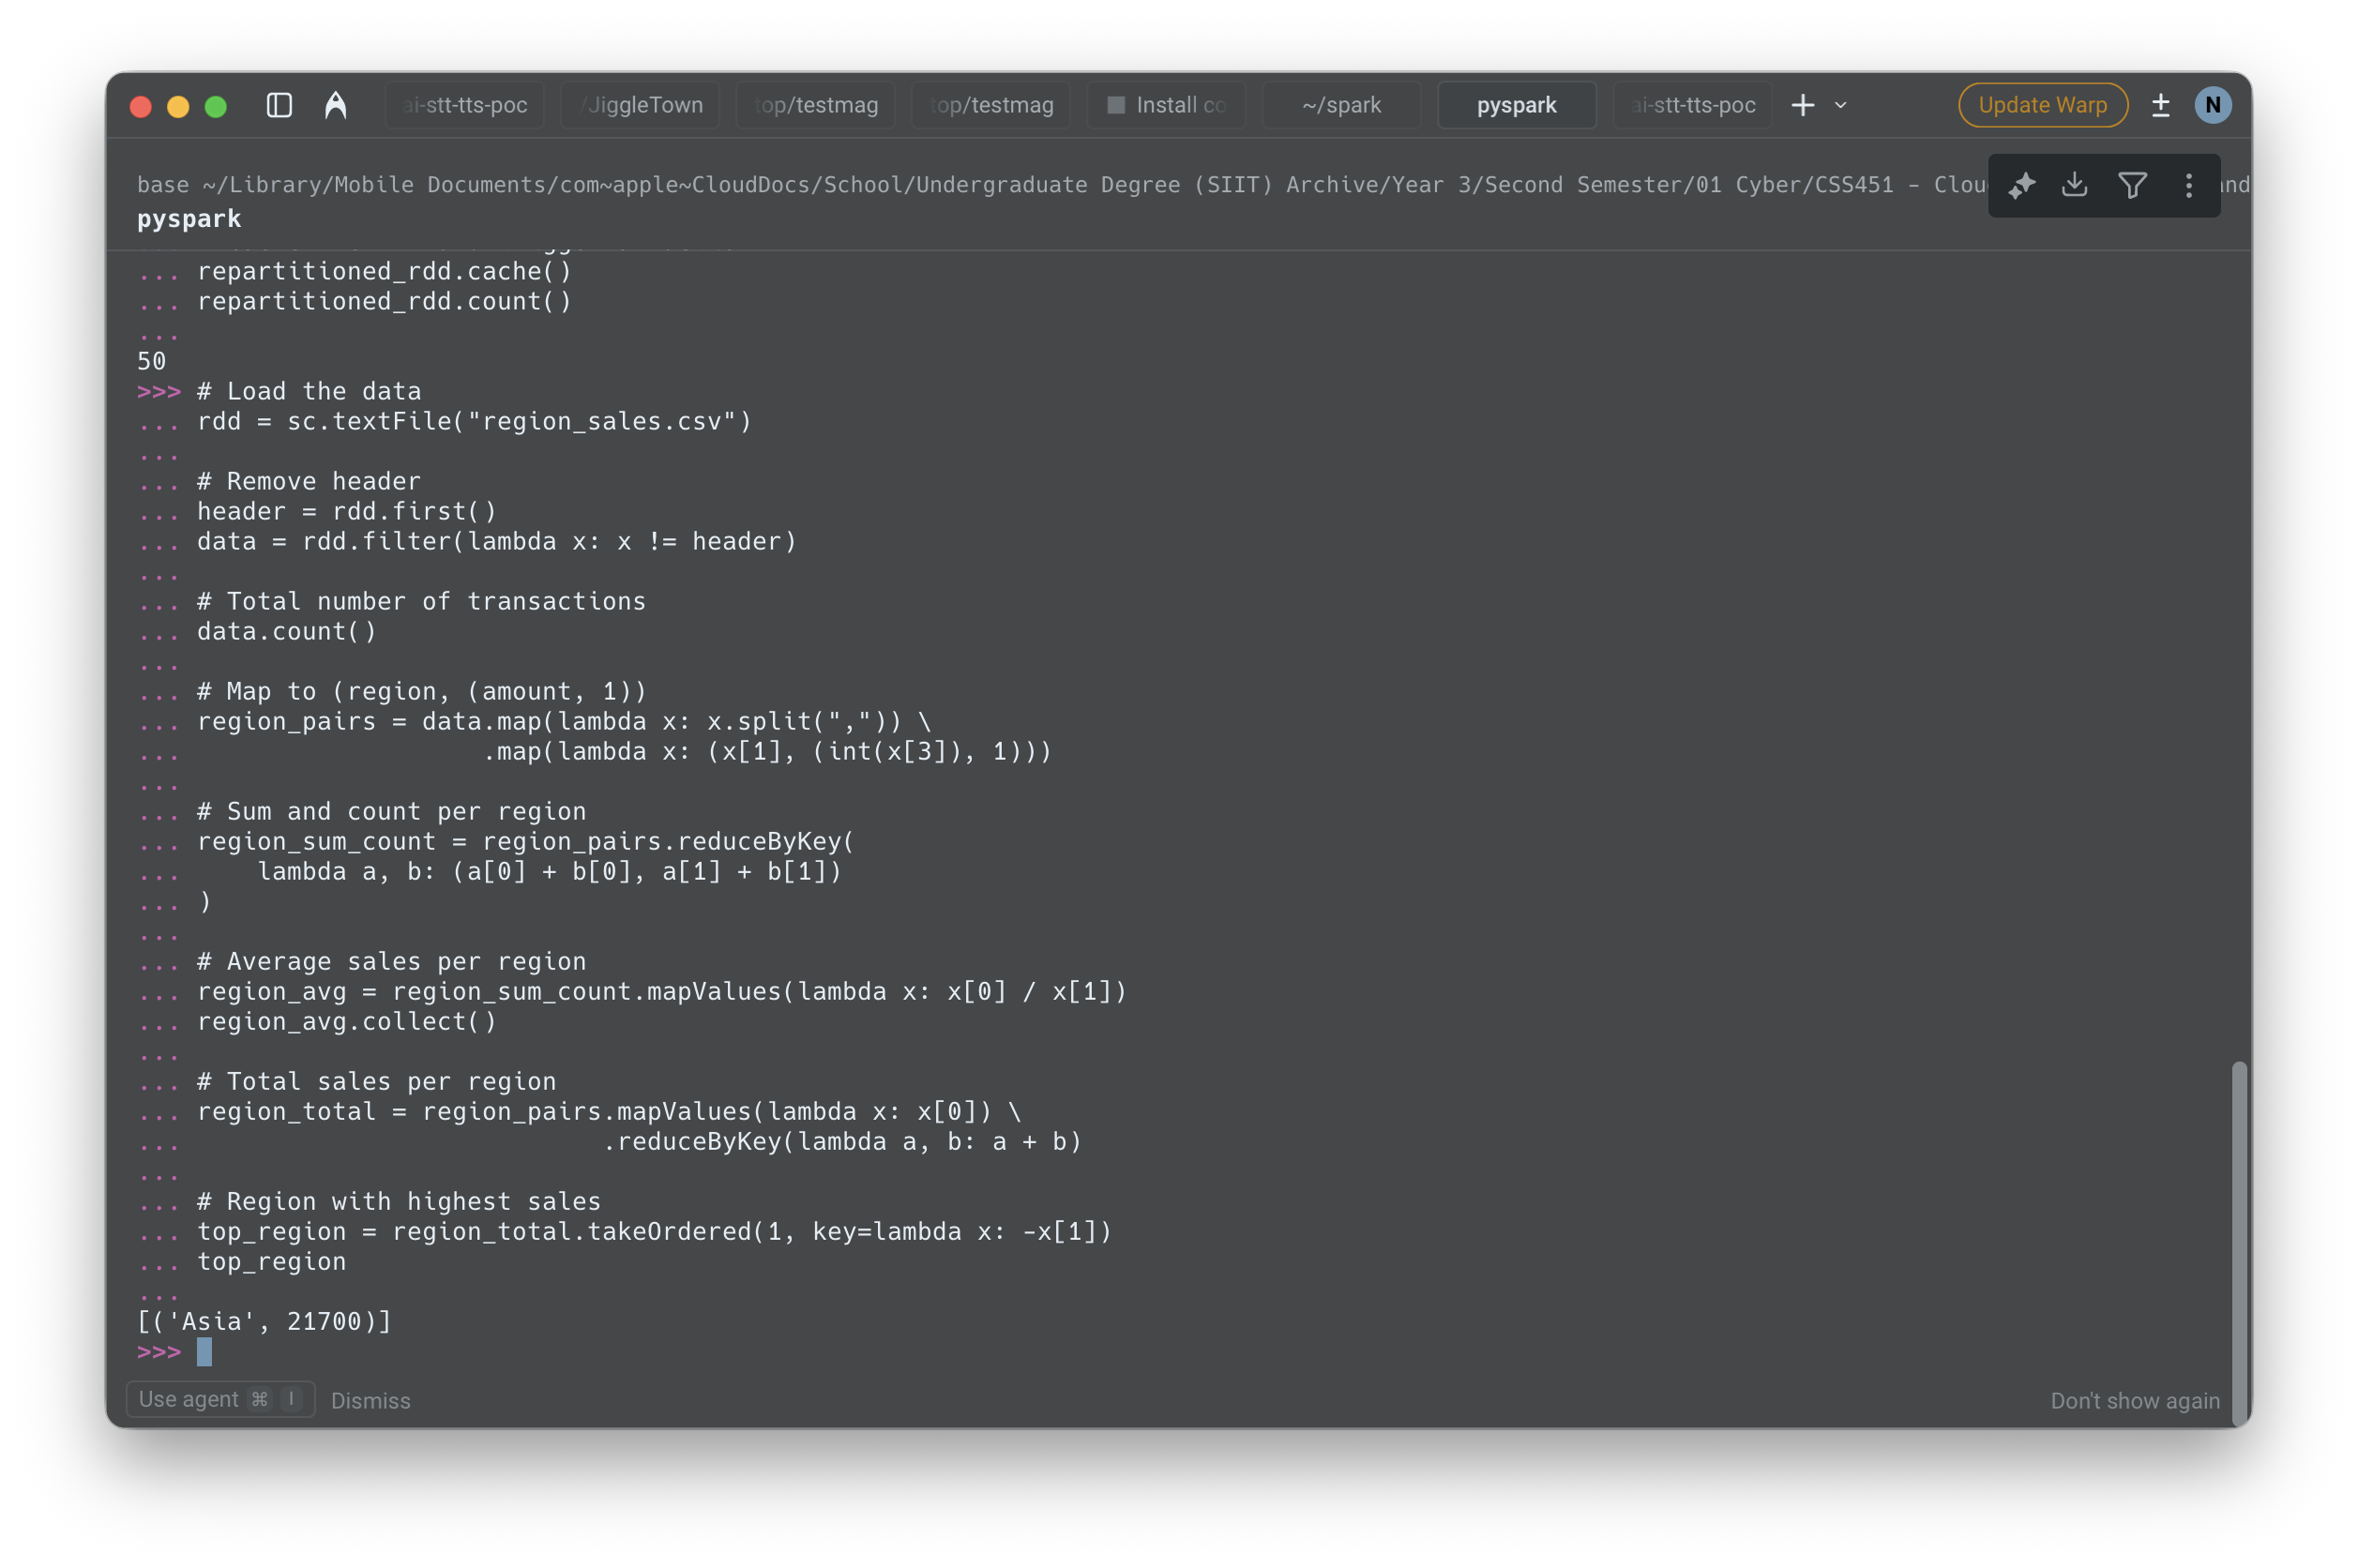
top_region
📸 Capture the output screenshot
Problem 4: Revenue per Payment Type & Trips
Dataset
nyc_yellow_tripdata_2015-90k.csv
Task
Compute total revenue per payment type using RDDs.
Instructions
Step 1: Run Spark Shell
spark-shellStep 2: Read CSV file
val taxiDF = spark.read
  .option("header", "true")
  .option("inferSchema", "true")
  .csv("nyc_yellow_tripdata_2015-2k.csv")

taxiDF.printSchema()
taxiDF.show(5)
Step 3: Convert DataFrame to RDD
val taxiRDD = taxiDF.rddStep 4: Compute Revenue per Payment Type
val revenuePerPaymentTypeRDD = taxiRDD
  .map(row => (
    row.getAs[Int]("payment_type"),
    row.getAs[Double]("total_amount")
  ))
  .aggregateByKey((0.0, 0))(
    (acc, amount) => (acc._1 + amount, acc._2 + 1),
    (acc1, acc2) => (acc1._1 + acc2._1, acc1._2 + acc2._2)
  )
  .sortBy(_._2, ascending = false)
Step 5: Print the result
println("=== Revenue and Trips per Payment Type ===")
revenuePerPaymentTypeRDD.collect().foreach {
  case (paymentType, (totalRevenue, tripCount)) =>
    println(s"PaymentType=$paymentType | Revenue=$totalRevenue | Trips=$tripCount")
}
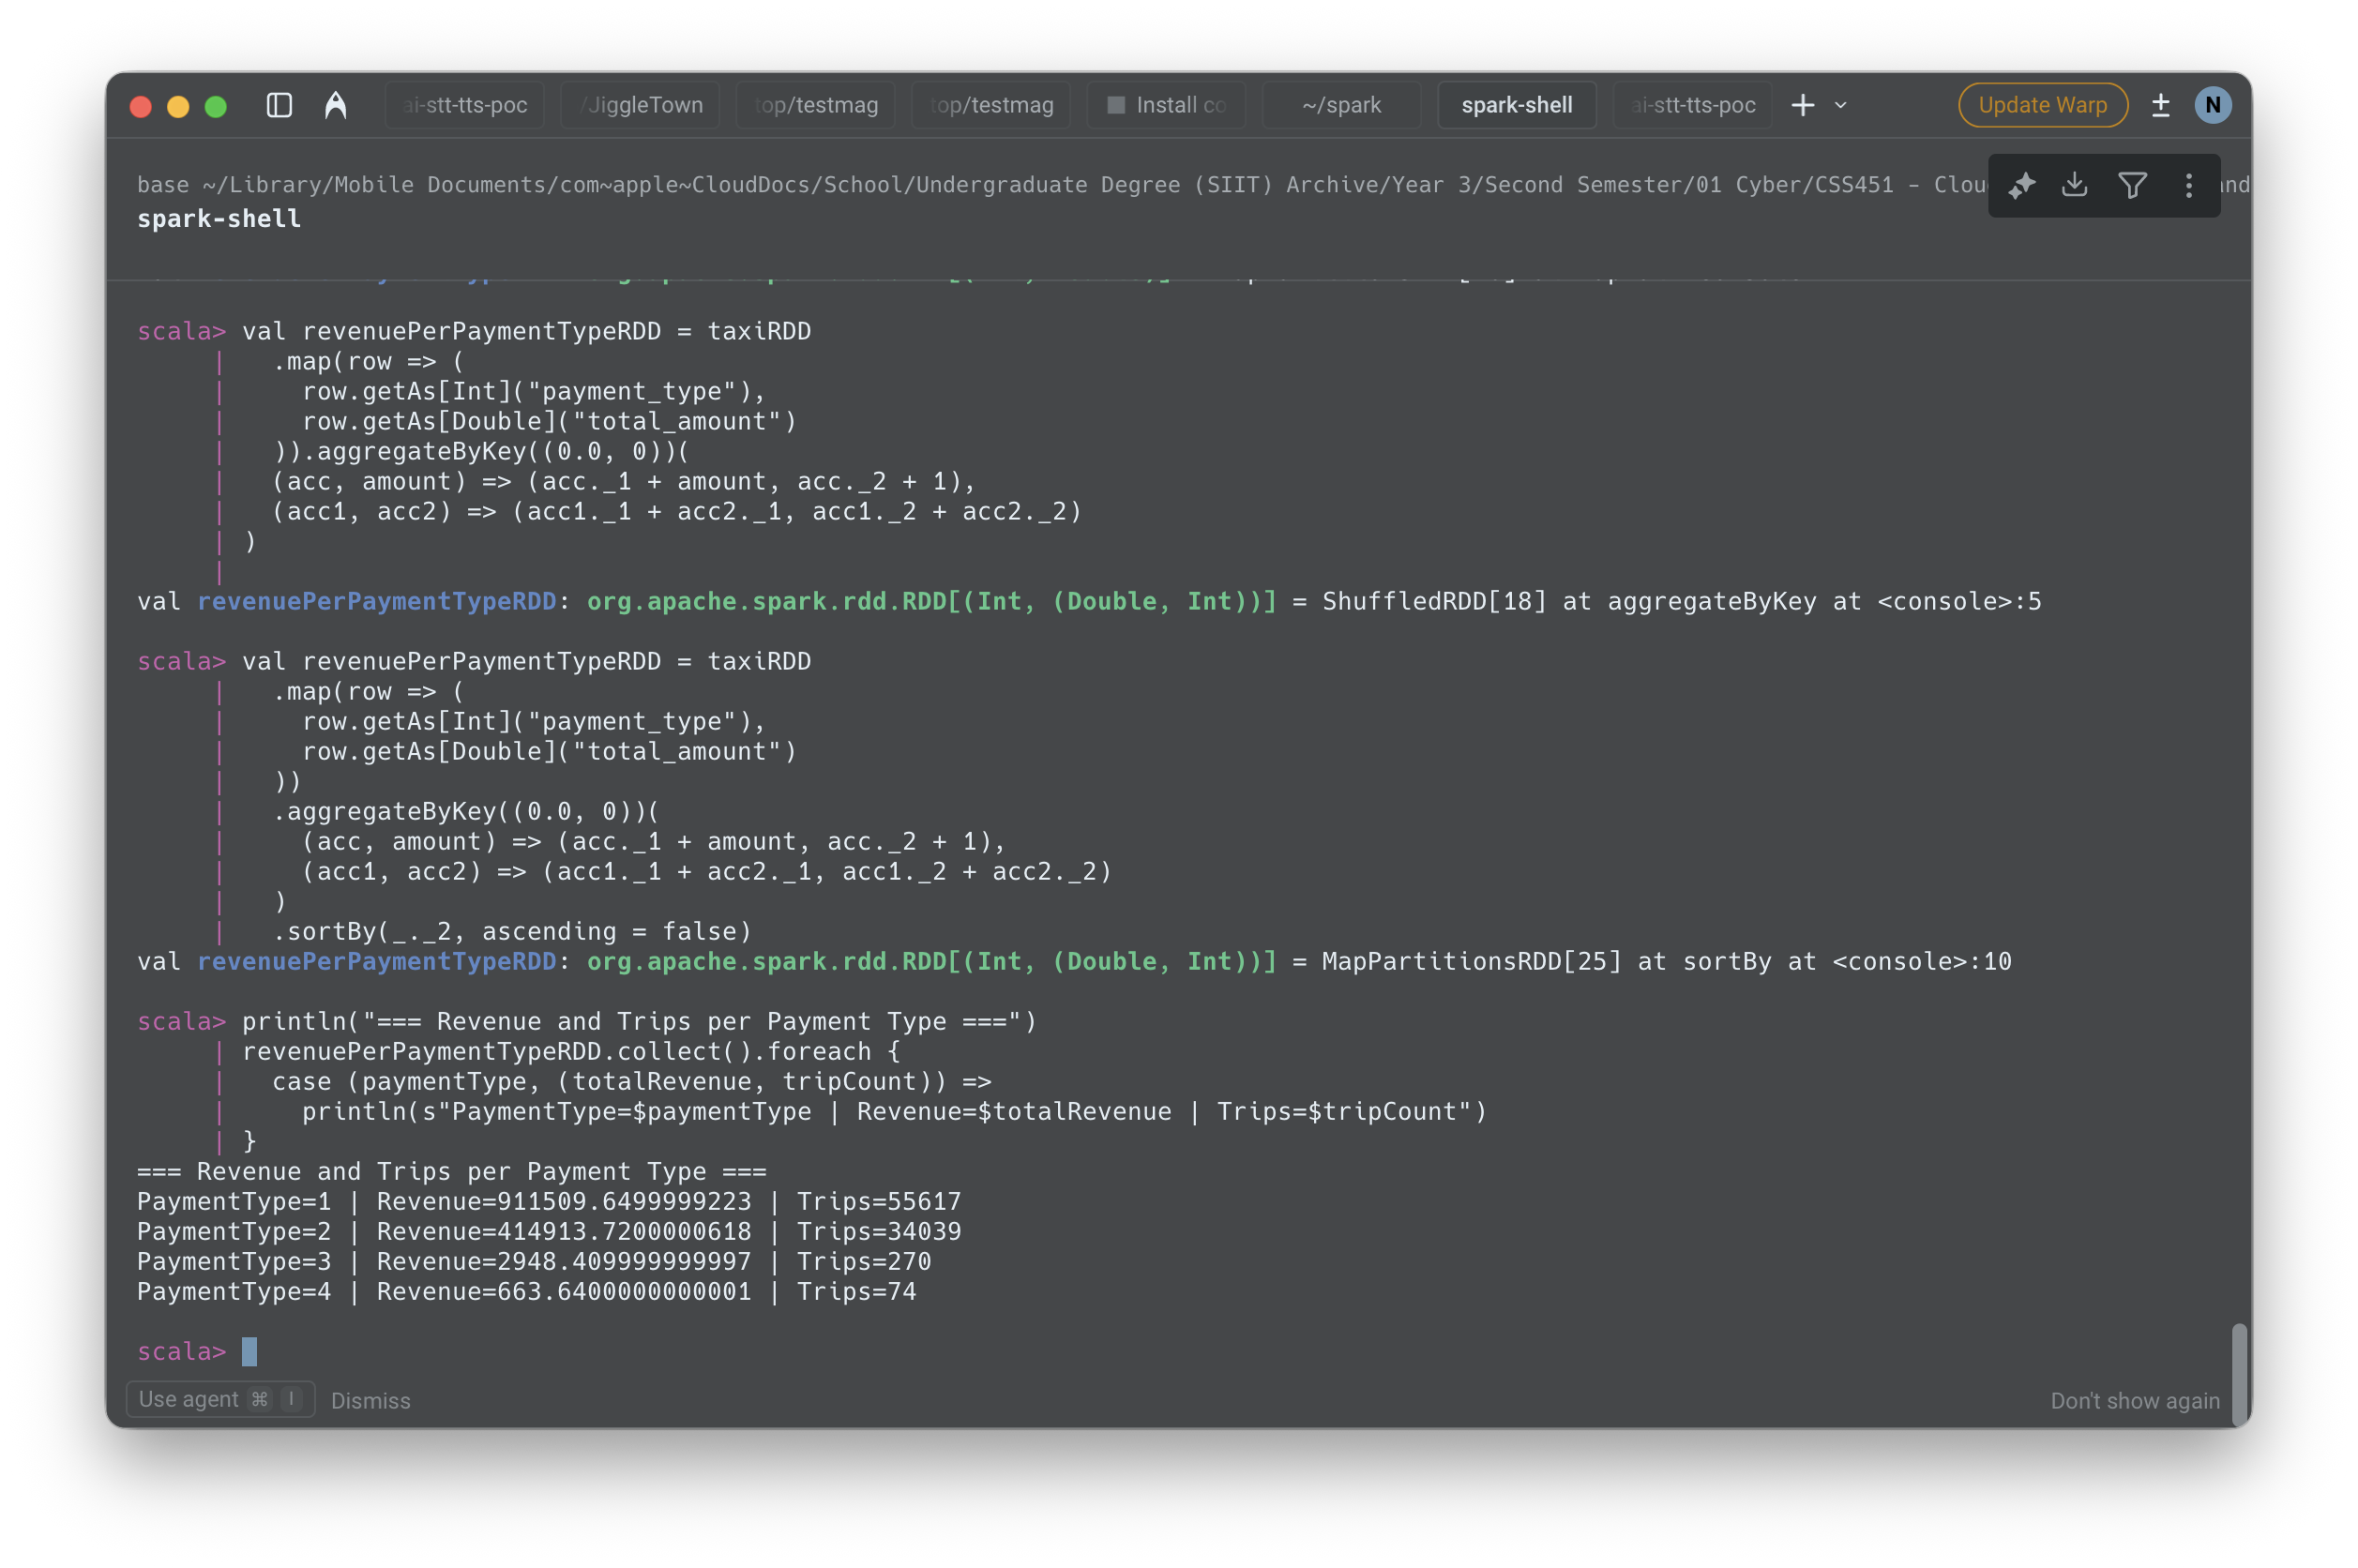
📸 Screenshots Required:
- Output of the revenue and trips per payment type
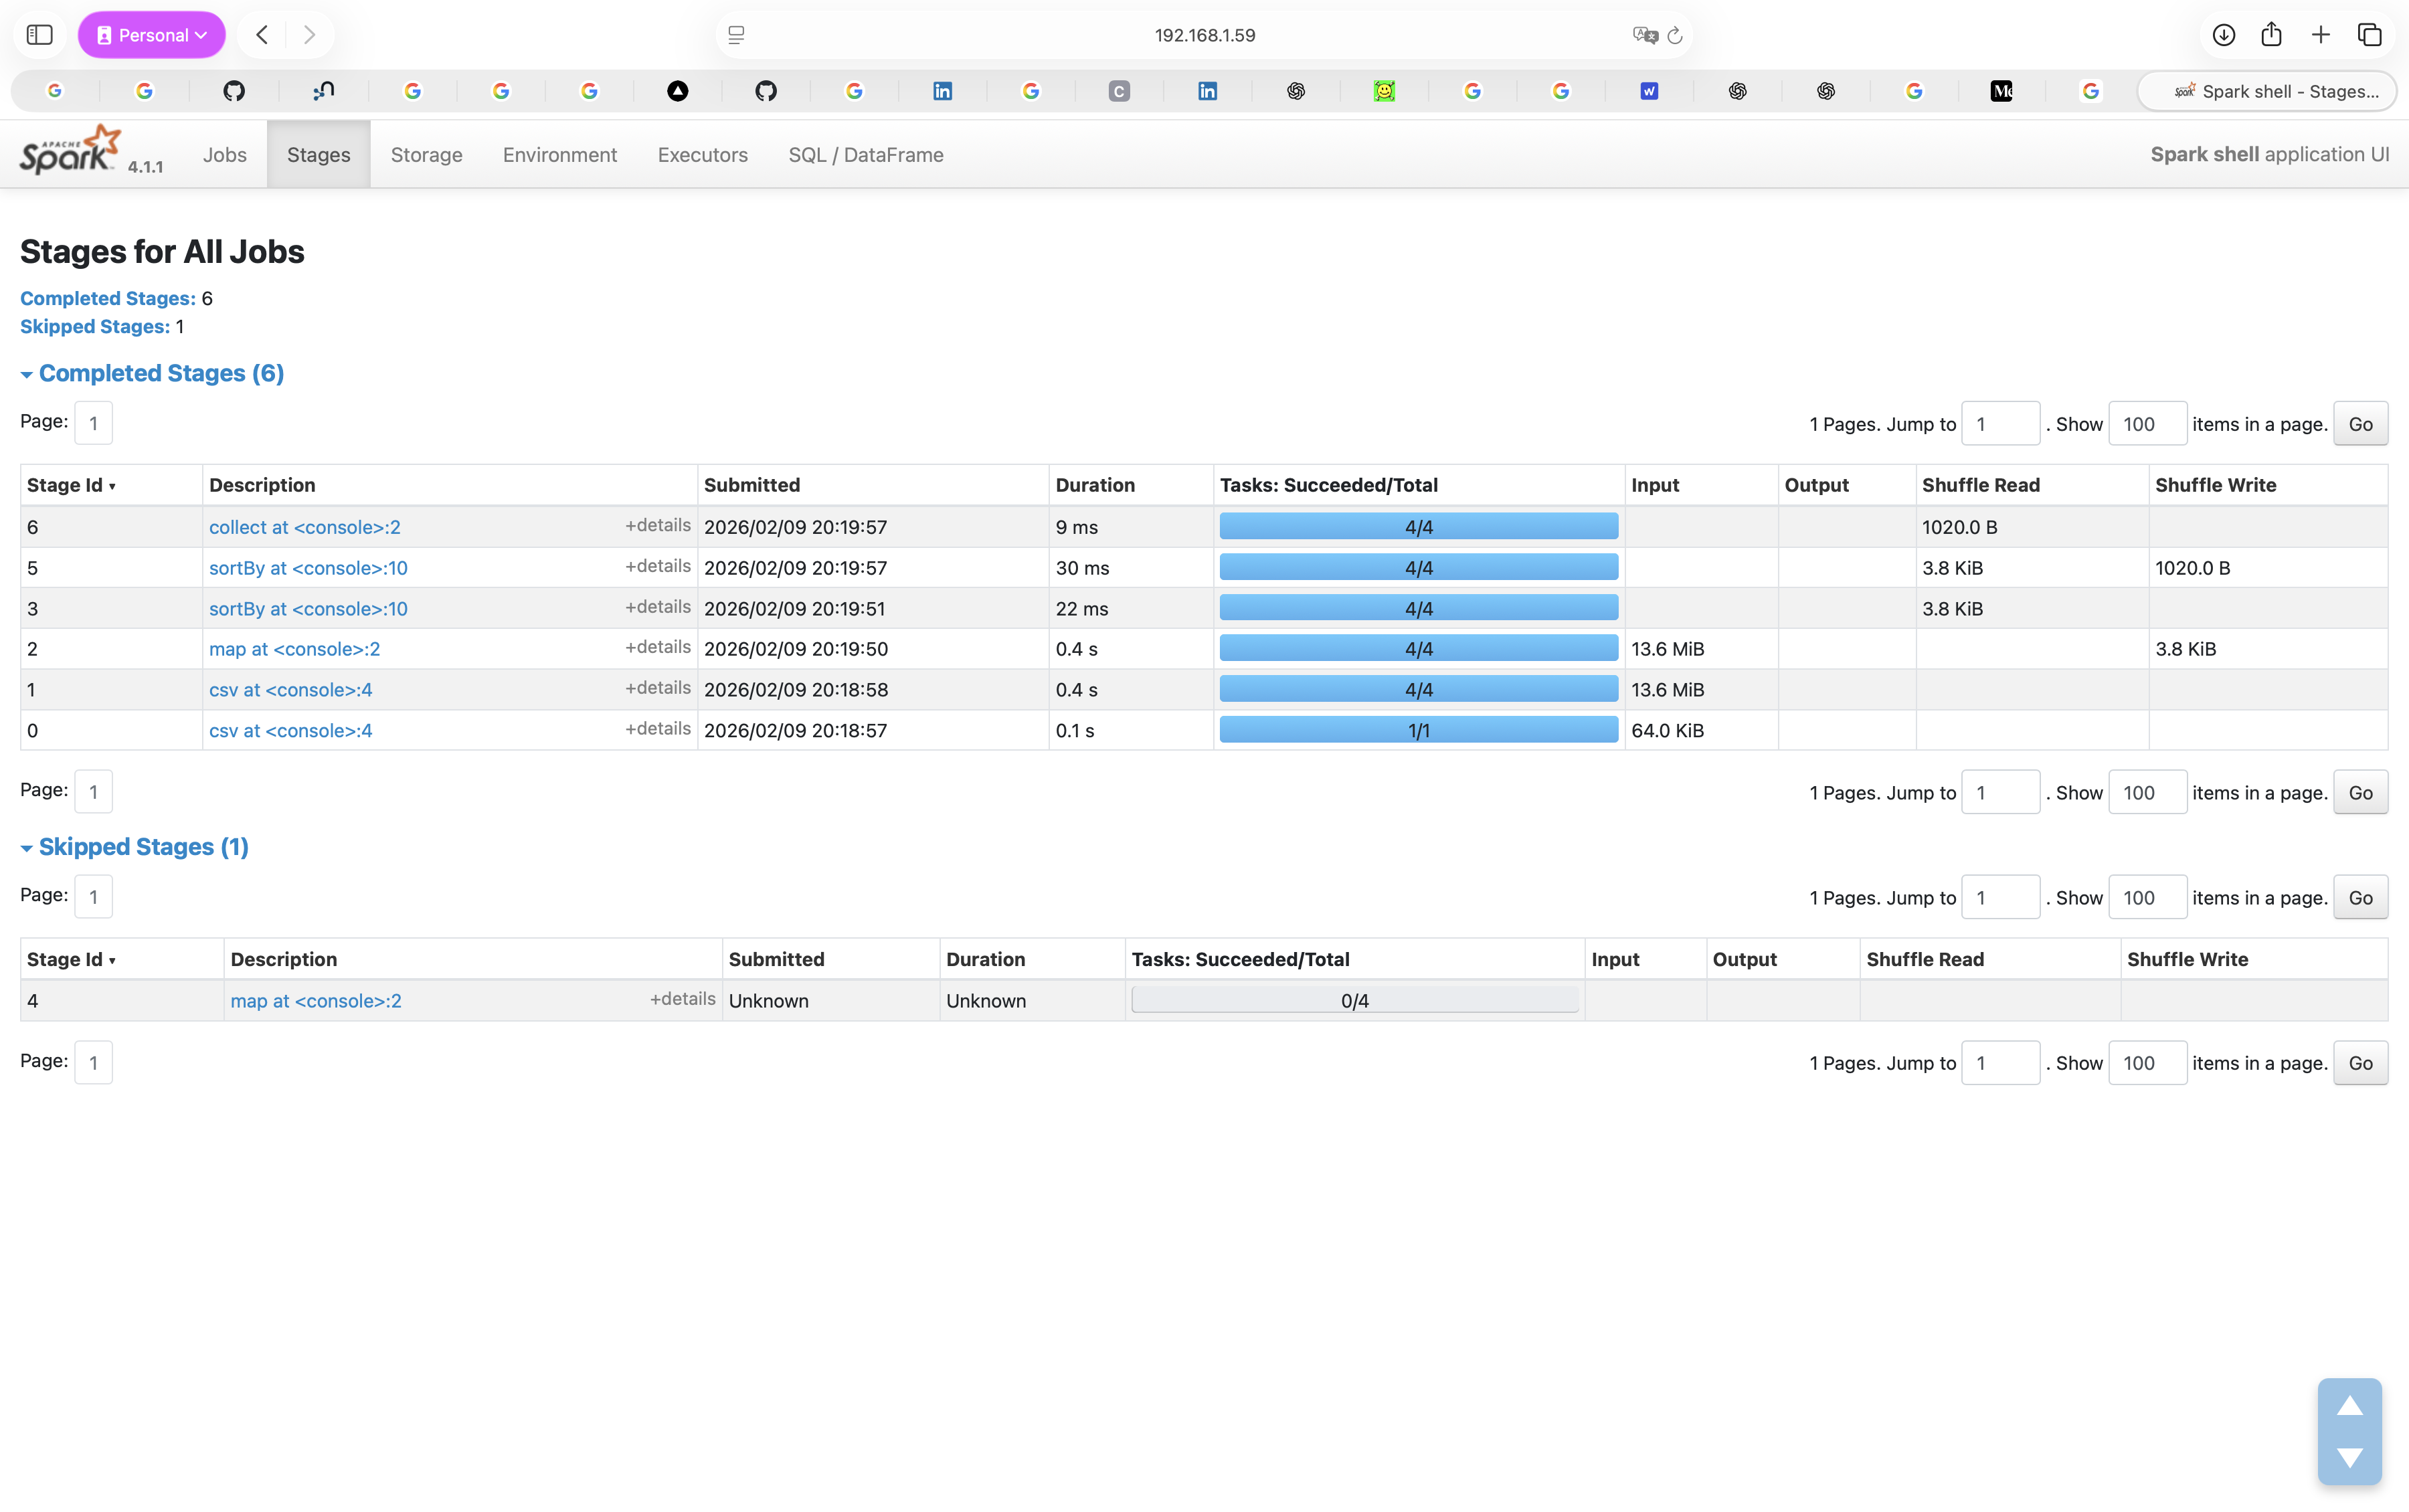
- Spark UI showing the number of stages executed for this job
Question
How many stages are executed for this job? (Check on the Spark UI)
Submission Checklist
- Problem 1: Screenshot of top students output
- Problem 2: Screenshot showing partitioning and caching
- Problem 3: Screenshot of analytical processing results
- Problem 4: Screenshot of revenue per payment type output
- Problem 4: Screenshot of Spark UI showing stages
- Answer to the question about number of stages